Operations | Monitoring | ITSM | DevOps | Cloud

Latest News

Thanks, Gartner! We're in the 2019 Magic Quadrant for APM

It’s raining accolades for ManageEngine Applications Manager, and we’re psyched! After being named a January 2019 Gartner Peer Insights Customers’ Choice for Application Performance Monitoring Suites, Gartner has also recognized Applications Manager as a niche player in its 2019 Magic Quadrant for Application Performance Monitoring.

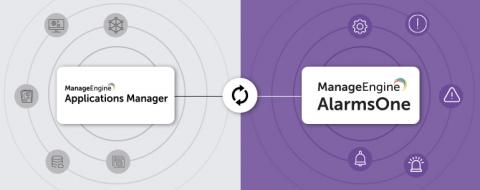
New integration offers a consolidated look at your APM alerts

Application monitoring and alerting go hand-in-hand. Alerts point out critical issues in your infrastructure and help you identify and remediate components causing service degradation and disruption. To reduce the complexity involved in managing IT alerts, we’ve developed an integration between our application monitoring tool, Applications Manager, and our alert management solution, AlarmsOne.

Budget Planning for Next-generation APM and Observability

If you’re trying to evaluate and understand the ROI of building an observability practice and carve out a budget for it, you’re not alone. You’ve probably got some monitoring and metrics capability already, but that’s proving to not be enough–how can you empower your teams as your environment becomes too complex for the basics? And how much will that cost?

EAM: A cost-effective alternative to APM

As with all our Application Performance Management (APM) blogs, we'd like to first append this with a few caveats. Firstly, we’re big fans of APM. For too long enterprise monitoring efforts have focused too heavily on infrastructure - and it was APM that first flipped this paradigm on its head. Secondly, we are by no means an APM tool – and whilst we’ll go into our differences later - we simply share the vision that applications should be put at the heart of your IT monitoring strategy.

2nd year in a row: Gartner recognizes ManageEngine in its Magic Quadrant for Network Performance Monitoring and Diagnostics

OpManager’s network monitoring capabilities have been serving the network administration industry for more than a decade. What started as a basic network monitoring tool has grown tremendously in terms of both features and operations, placing OpManager among the top network monitoring tools in the network administration domain.

PHP monitoring with Datadog APM and distributed tracing

Since its release in 1995, PHP has been one of the most popular server-side languages for building web applications. It supports a wide range of web servers, databases, and operating systems. PHP developers use popular frameworks like Laravel, Symfony, and Zend to deploy and manage sites that serve high volumes of traffic. To help you monitor PHP performance, identify bottlenecks, and optimize your users’ experience, we’re pleased to announce APM & distributed tracing for PHP.

OpsRamp Gains Ground in 451 Research's 2019 Market Map for Application and Infrastructure Performance

We’re thrilled to announce that for the second year in a row, 451 Research has positioned OpsRamp in their flagship Market Map report for Application and Infrastructure Performance. 451 Research recognized OpsRamp for its innovative use cases in four distinct performance management categories: Infrastructure Monitoring, Event Analytics, Alerting, and Synthetics. You can read an excerpt of the 2019 Market Map report HERE.

Making The Most Out of Your Performance Monitoring Investments in 2019

Our recent webinar on 2019 Performance and Management Trends and Insights featured Nancy Gohring, Senior Analyst at 451 Research and Darren Cunningham, VP of Marketing at OpsRamp. The webinar reviewed key findings from recent surveys on performance monitoring and how IT automation investments (artificial intelligence and machine learning) are helping enterprises combat the twin problems of alert fatigue and incident downtime.