Operations | Monitoring | ITSM | DevOps | Cloud

Latest News

How eG Enterprise solves uncertainty and challenges in the world of hypervisors and virtualization migration

In a recent blog article, we covered how the license changes for VMware virtualization may impact many of our partners and customers and are driving uncertainty in the market and causing many to consider their virtualization migration strategy, see Will Broadcom’s plans for VMware affect you? | eG Innovations.

Using Kubectl Logs | Complete Guide to viewing Kubernetes Pod Logs

Information about the containers and pods on your cluster may be obtained using the kubectl logs command. These logs allow you to know the performance of your applications, whether they are failing or healthy, and are particularly useful for debugging and troubleshooting purposes. In this article, we will see how to use the kubectl logs command to get information from existing resources in a Kubernetes cluster. Before we dive in, let's first take a quick look Kubernetes architecture and logging.

Kubernetes Logging | Set Up K8s Log Monitoring with OpenTelemetry

Kubernetes is a powerful orchestration tool for managing containers, but it comes with its own set of challenges. One of the biggest hurdles is effectively logging what's happening in your system. As your applications grow and spread across clusters, keeping track of their behavior becomes crucial. In this article, we will discuss logging in Kubernetes, common Kubernetes log types, and how logs can be effectively tracked and managed.

Latest Top 11 Observability Tools in Spotlight - 2024's Guide

In microservices architecture, observability tools enable you to create central dashboards to gauge the health of your distributed systems. New age observability tools have shifted to providing quick workflows to debug application issues. In this post we will explore top 11 observability tools that you can consider to use for your software systems. In today's digital economy, distributed architectures have become the norm.

Kubectl Top Pod/Node | How to get & read resource utilization metrics of K8s?

Kubectl Top command can be used to retrieve snapshots of resource utilization of pods or nodes in your Kubernetes cluster. Resource utilization is an important thing to monitor for Kubernetes cluster owners. In order to monitor resource utilization, you can keep track of things like CPU, memory, and storage. In this article, we will see how to use kubectl Top command to get and read metrics about pods and nodes. We will also breakdown the output to understand what it means.

Kubectl Logs Tail | How to Tail Kubernetes Logs

The kubectl logs tail command is a tool that allows users to stream the logs of a pod in real-time while using Kubernetes. This command is particularly useful for debugging and monitoring applications, as it enables users to view log output as it is generated and quickly identify any issues or problems with their application. In this article, we will see how to use the kubectl logs tail command to stream logs, the benefits of using the command, and an advanced tool for streaming logs.

MAUI provider upgrades v2: Real User Monitoring + Crash Reporting

I’ve written previously about the process of adding Real User Monitoring capabilities to our MAUI provider. I’m excited to say that this work is now live, batteries and all, plus some more improvements since the last blog. To recap the state of cross-platform development in the.NET ecosystem, Xamarin is out of support as of May 1st! This is replaced by.NET MAUI (Multi-platform App UI), meaning developers need appropriate tools when they make the switch.

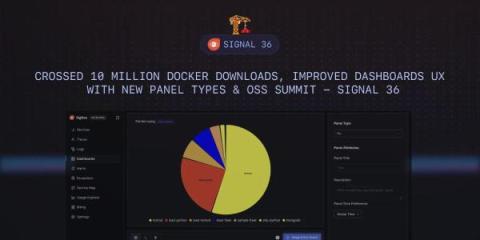
Crossed 10 Million Docker Downloads, Improved Dashboards UX with New Panel Types & OSS Summit - SigNal 36

Welcome to SigNal 36, the 36th edition of our monthly product newsletter! We crossed 10 Million Docker downloads for our open source project. We’ve enhanced our Dashboards UX and incorporated feedback from users in different areas of our product. Let’s see what humans of SigNoz were up to in the month of April 2024.
Sponsored Post

JS Toolbox 2024: Frameworks and static site generators

In 2024, JavaScript is bigger than ever. The ecosystem is just as huge, and almost impossible to keep track of - so I've had a go at picking out 2024's most essential JS tools for you. In part 1 of this series, we reviewed runtimes and package managers, the foundational building blocks of your software project. So in part 2, we're analyzing the tools which form the walls and roof that give your software project its structure: frameworks and static site generators. For this installment of JS Toolbox 2024, we explore various frameworks & generators available in the JavaScript & TypeScript ecosystem, analyzing their strengths, weaknesses, and ideal use cases.

Cisco announces standalone Secure Application, offering increased flexibility to security teams

Cisco's Secure Application is now available as an independent application on the Cisco Observability Platform and can be deployed with or without Cisco Cloud Observability. This announcement increases the flexibility offered to IT professionals and allows in house security teams to harness powerful security capabilities without committing to cloud native application performance monitoring.