Operations | Monitoring | ITSM | DevOps | Cloud

Latest News

Top 11 Kubernetes Monitoring Tools[Includes Free & Open-Source] in 2024

Are you looking for Kubernetes monitoring tools? Then you have come to the right place. Kubernetes has grown to become the container orchestration platform of choice. It simplifies managing your containerized workloads. You get the power of automating deployments, scaling resources, and keeping your applications running smoothly. But with great power comes added responsibility. And like any complex system, Kubernetes needs monitoring.

Key considerations when choosing the right application performance monitoring tool for your business

In today’s technology-driven world, applications are the lifeblood of businesses and the cornerstone of user interactions. From e-commerce platforms to social media networks, flawless application performance is no longer a mere expectation but a fundamental requirement for user satisfaction and business success. However, lurking beneath the surface of seemingly smooth operations lie potential pitfalls that can quickly transform a positive user experience into a nightmare.

Three Pillars of Observability [And Beyond]

Observability is often defined in the context of three pillars: logs, metrics, and traces. Modern-day cloud-native applications are complex and dynamic. To avoid surprises and performance issues, you need a robust observability stack. But is observability limited to collecting logs, metrics, and traces? How is observability evolving to make our systems more observable? In this tutorial, we cover.

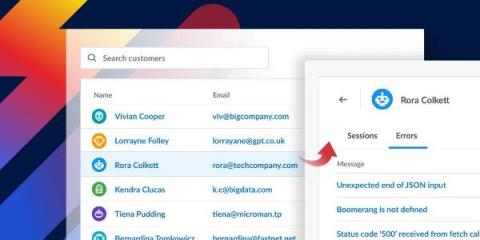
3 secure ways to handle user data in Raygun

You know the feeling: You’re right in the middle of cracking a really convoluted coding problem, when an urgent support ticket pops up. It’s not just any ticket; it’s from a VIP customer with a high-severity issue demanding resolution within an hour. You have to drop what you’re doing and scramble, completely context-switching and losing all your momentum.

Detecting PowerShell Exploitation

In today’s digital landscape, cybersecurity is a top priority for organizations. Hackers are continuously finding new ways to exploit vulnerabilities and compromise systems. PowerShell, a powerful scripting language and automation framework developed by Microsoft, has unfortunately become a favored tool among attackers due to its capability to run.NET code and execute dynamic code downloaded from another system (or the internet) and execute it in memory without ever touching disk.

5 Ways AIOps Monitoring Benefits EUC Environments

The adoption of AIOps monitoring technologies has been somewhat slower in EUC than many other areas of IT. The legacy VDI and DaaS vendor tools set expectations low for many. It is still relatively common for us to come across potential customers who are using legacy tools and manually exporting 6 months of data into an excel spreadsheet to try and work out average and peak usage of resources such as CPU to then manually calculate alert thresholds.

Using OpenTelemetry Collector Loki Receiver to Send Logs to SigNoz [Code Tutorial]

In this tutorial, you will learn how to collect logs using the Loki receiver in OpenTelemetry Collector to send logs to SigNoz. If you’re using Promtail to collect logs, you can send them to SigNoz instead of Loki via the OpenTelemetry Collector. In this tutorial, we cover: If you want to jump straight into implementation, start with this prerequisites section.

Monitor HAProxy Metrics and Logs with OpenTelemetry [Step By Step Guide]

For extremely high throughput web applications, it is important to load balance the traffic across multiple servers. However, load balancing the traffic alone is not enough at times. The reverse proxy server that handles the workload needs to be performant, too. In our previous article, we discussed the NGINX reverse proxy server and understood how to monitor it. In this article, we set up monitoring for an even more performant reverse proxy server - HAProxy.

Is your Java Observability tool Lambda Expressions aware?

Most SREs and IT Ops manage Java applications without source code access or communication with AppDev teams. When applications have performance issues those SREs or IT Ops teams deploying and maintaining the infrastructure often have to prove that it is the application at fault and supply information to the app supplier which provides evidence of the issue.