Operations | Monitoring | ITSM | DevOps | Cloud

Latest News

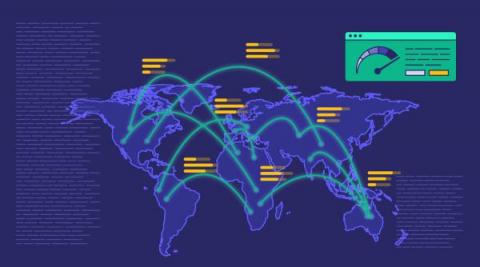
Observability to Modernize Apps and Increase Business Resilience

Increasingly, the speed and scale of a business can be measured by the resilience and performance of its applications. That’s why organizations are opting to modernize legacy applications by rewriting them using cloud-native tools and platforms. A Gartner study found that by 2025, cloud-native platforms will be the foundation for more than 95% of new digital initiatives, compared to less than 40% in 2021.

Everything You Should Know About Windows Event Logs

If you’ve ever seen Indiana Jones and the Last Crusade, you might remember the scene where Indy and his dad are in a room replete with the most ornate chalices possible, only to realize that the Holy Grail is the most plain, utilitarian one in the room. Windows event logs are the IT version of the plain-looking clay cup that holds the key to answering your service questions and system issues.

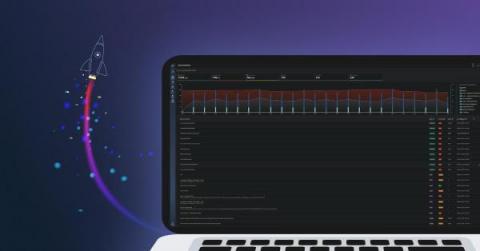
How to Get Full Kubernetes Observability in Minutes

How is your organization handling Kubernetes observability? What tools are you using to monitor Kubernetes? Is it a time-consuming, manual process to collect, store and visualize your logging, metrics and tracing data? And, what are you actually getting out of all that investment? At Logz.io we’re trying to make this process easier for customers who are serious about Kubernetes observability. We’ve made significant investments in this area for Kubernetes use cases.

Elasticsearch Open Source Monitoring Tools [2023 Comparison]

This article is the third of a four-part series of articles about Elasticsearch monitoring. In the first article, we put together an Elasticsearch guide, covering how Elasticsearch works and why the setup and tuning of Elasticsearch requires a good knowledge of configuration options and performance metrics.

Surface and Confirm Buggy Patterns in Your Logs Without Slow Search

Incidents happen. What matters is how they’re handled. Most organizations have a strategy in place that starts with log searches—and logs/log searching are great, but log searching is also incredibly time consuming. Today, the goal is to get safer software out the door faster, and that means issues need to be discovered and resolved in the most efficient way possible.

Using Logs to Troubleshoot Failing Cron Jobs

Let’s say you have a script that works when run in an interactive session, but does not produce expected results when run from cron. What could be the problem? Some potential culprits include: Or it could be something else. How to troubleshoot this then, and where to start? Instead of trying fixes at random, I prefer to start by looking at logs.

Monitoring with Prometheus vs Grafana: understanding the difference

Observability has become one of the most important areas of your application and infrastructure landscape, and the market has an abundance of tools available that seem to do what you need. In reality, however, most products - especially leading open source tools - were created to solve a single problem extremely well, and have added additional supporting functionality to become a more robust solution; but the non-core functionality is rarely best of breed. Examples of these are Prometheus and Grafana.

Reduce MTTR with Logz.io's Single-Pane-of-Glass Observability Data Analytics

Observability data provides the insights engineers need to make sense of increasingly complex cloud environments so they can improve the health, performance, and user experience of their systems. These insights can quickly answer business-critical questions like, “what is causing this latency in my front end?” Or, “why is my checkout service returning errors?” Observability is about accessing the right information at the right time to quickly answer these kinds of questions.

Detect data exfiltration activity with Kibana's new integration

Does your organization’s data include sensitive information, like intellectual property or personally identifiable information (PII)? Do you want to protect your data from being stolen and sent (i.e., exfiltrated) to external web services? If the answer to these questions is yes, then Elastic’s Data Exfiltration Detection package can help you identify when critical enterprise data is being stolen and exfiltrated.

Easily analyze AWS VPC Flow Logs with Elastic Observability

Elastic Observability provides a full-stack observability solution, by supporting metrics, traces, and logs for applications and infrastructure. In a previous blog, I showed you how to monitor your AWS infrastructure running a three-tier application. Specifically we reviewed metrics ingest and analysis on Elastic Observability for EC2, VPC, ELB, and RDS.