Operations | Monitoring | ITSM | DevOps | Cloud
Latest News
Supercharging Elasticsearch with the Power of Telemetry Pipelines
Elasticsearch has made a name for itself as a powerful, scalable, and easy-to-use search and analytics engine, enabling organizations to derive valuable insights from their data in real-time. However, to truly unlock the potential of Elasticsearch, it is essential that the right data in the right format is provisioned to Elasticsearch. This is where integrating a telemetry pipeline can add value to Elasticsearch.
Supercharging Grafana with the Power of Telemetry Pipelines
Grafana is a popular open-source tool for visualizing and analyzing data from various sources. It provides a platform for creating interactive, customizable dashboards that display real-time data in various formats, including graphs, tables, and alerts. When powered by Mezmo's Telemetry Pipeline, Grafana can access a wide range of data sources and provide a unified view of the performance and behavior of complex systems.
Gaming Industry: How Important are Logs for Systems?
In today’s fast-paced and highly-competitive gaming industry, providing a seamless and enjoyable gaming experience is essential to retain users. Games need to be responsive, offer high-resolution graphics, continuous uptime, and handle a huge amount of transactions. Having strong log analytics solution is essential to improve performance, identify issues, and fine-tune the player experience.
The Latest Version of OpenSearch Is Now Live On Logit.io
Logit.io is pleased to introduce the latest version of OpenSearch onto the platform, with an OpenTelemetry-compliant data schema that unlocks a host of future analytics and observability capabilities. Also included in this release are improvements in threat detection for security analytics workloads, visualization tools, and machine learning (ML) models.
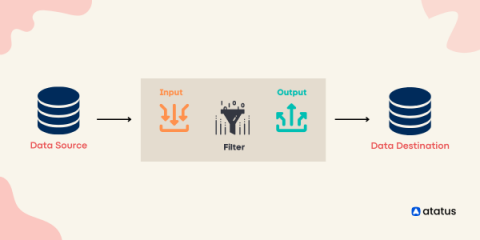
Log Shippers: The Key to Efficient Log Management
Logs are a vital source of information for any system, providing valuable insights into its performance and behaviour. However, with the increasing complexity of modern systems and the massive amount of data generated by them, managing logs can be a daunting task. This is where log shippers come into play. Log shippers are tools designed to simplify the process of collecting and forwarding log data to a centralized location, allowing for easy analysis and troubleshooting.
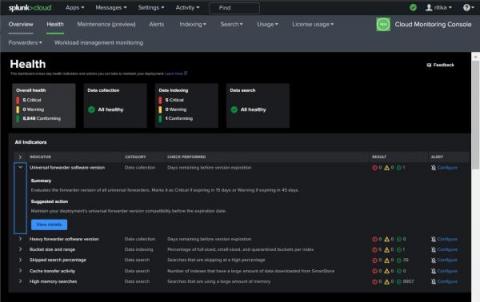
Cloud Monitoring Console's Health Dashboard: Maximize Your Monitoring Efficiency
Introducing CrowdStream: A New Native CrowdStrike Falcon Platform Capability Powered by Cribl
We’re excited to announce an expanded partnership with CrowdStrike and introduce CrowdStream, a powerful new native platform capability that enables customers to seamlessly connect any data source to the CrowdStrike Falcon platform.
Monitoring service performance: An overview of SLA calculation for Elastic Observability
Elastic Stack provides many valuable insights for different users. Developers are interested in low-level metrics and debugging information. SREs are interested in seeing everything at once and identifying where the root cause is. Managers want reports that tell them how good service performance is and if the service level agreement (SLA) is met. In this post, we’ll focus on the service perspective and provide an overview of calculating an SLA.


