Operations | Monitoring | ITSM | DevOps | Cloud

Latest News

Coralogix Provides Highly Scalable Traces For Your Success

While more observability vendors are providing tracing ingestion and visualization as part of their core service, only Coralogix, the leading in-stream observability platform, supports a set of data optimization features that drive down cost, maximize insights and create a scalable tracing strategy unlike others.

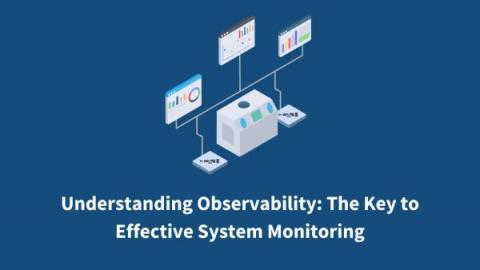
Understanding Observability: The Key to Effective System Monitoring

In the rapidly evolving landscape of modern tech, system reliability has become a critical factor for businesses to succeed. To ensure the stability and performance of complex distributed systems, companies are relying on observability—a concept that isn’t synonymous, but instead goes beyond traditional monitoring approaches.

How to reindex your Elasticsearch data

The Elasticsearch reindex API copies data from one index to another. You can use reindex to change the index mapping, copy data to another cluster, or copy only a subset of data to another index. For example, suppose you want to reindex all the data in index1 into index2. In that case, you run the following example in Kibana dev tools: In this article, we dive into some common issues solved by reindexing as well as troubleshooting issues with reindexing itself.

Less is more: industry leaders share their success with tool consolidation for maximized productivity

We’ve known for years that context switching is detrimental to productivity. Both computers and humans become less productive with each additional concurrent task or priority. Every time you need to shift your focus between projects, you lose approximately 20% efficiency as you figure out where you left off, what needs to be done, how the work fits into the project, etc.

Goats on the Road: RSA 2023 Recap

Dr. Anton Chuvakin, a noted warrior/poet/security cybersecurity expert, sums up my thoughts about RSAC 2023 marketing messaging perfectly with this post on Twitter. For those who are new to the vendor hall, the amount of just bad marketing can be overwhelming and confusing. . There’s only one chance to get your message across to your prospects, so make it short and sweet. Anton’s guess of “zero click zero trust” is closer than you think to the truth.

A Log's Life Cycle in Coralogix

Coralogix is a full-stack observability platform that effortlessly processes logs, metrics, traces, and security data. More specifically, logs in Coralogix are processed in larger volumes than almost any other observability provider out there, making a log’s life cycle unique. This article will examine the different stages of logs and help you better understand one of the most sophisticated telemetry processing architecture on the market.

Transport Your Logs to AppSignal with Winston

AppSignal Logging gives you 360-degree insights into your application's performance. To help give you those insights, we wanted to ensure our logging solution allowed you to send AppSignal your logs your way. You can now use Winston transport to send your Node.js application's logs directly to AppSignal and take advantage of having access to all of your application's performance logs and metrics in one place.

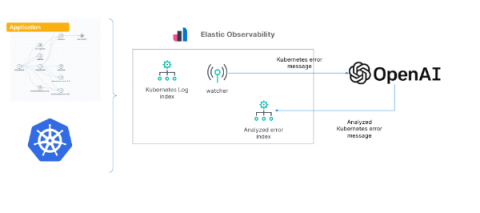
Gain insights into Kubernetes errors with Elastic Observability logs and OpenAI

As we’ve shown in previous blogs, Elastic® provides a way to ingest and manage telemetry from the Kubernetes cluster and the application running on it. Elastic provides out-of-the-box dashboards to help with tracking metrics, log management and analytics, APM functionality (which also supports native OpenTelemetry), and the ability to analyze everything with AIOps features and machine learning (ML).

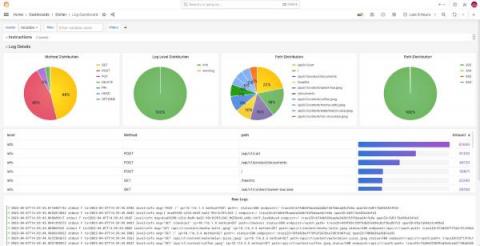
6 easy ways to improve your log dashboards with Grafana and Grafana Loki

Because of where you’re reading this post, I’m going to assume you already know that Grafana is a great tool for visualizing and presenting metrics, and persisting them on dashboards. Ever since the Grafana Loki query builder for LogQL was introduced in 2022, it’s been easy to display and visualize logs, too.