Operations | Monitoring | ITSM | DevOps | Cloud

Latest News

Dashboard Design: Getting Started With Best Practices (Part 1)

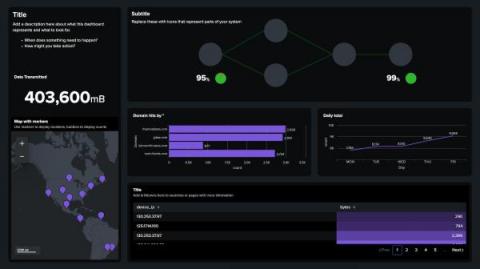
Every day, dashboards are viewed more than 500,000 times at Splunk. They’re what make the sea of data intelligible and help tell a story when working with a team. However, constant net-new dashboard creation is not necessarily a value-add activity — it’s a workflow to rapidly turn data into doing.

How to monitor Vault with Google Cloud Platform

Monitor Vault in Google Cloud Platform with the Google Ops Agent. The Ops Agent is available on GitHub, and makes it easy to collect and ship telemetry from dozens of sources directly to your Google Cloud Platform. You can check it out here! Below are steps to get up and running quickly with observIQ’s Google Cloud Platform integrations, and monitor metrics and logs from Vault in your Google Cloud Platform.

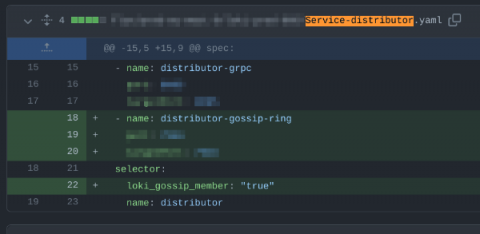
How adding Kubernetes label selectors caused an outage in Grafana Cloud Logs - and how we resolved it

Hello, I’m Callum. I work on Grafana Loki, including the hosted Grafana Cloud Logs offering. Grafana Loki is a distributed multi-tenant system for storing log data — ingestion, querying, all that fun stuff. It also powers Grafana Cloud Logs.

OpenTelemetry Logs, OpenTelemetry Go, and the Road Ahead

We’ve got a lot of OpenTelemetry-flavored honey to send your way, ranging from OpenTelemetry SDK distribution updates to protocol support. We now support OpenTelemetry logs, released a new SDK distribution for OpenTelemetry Go, and have some updates around OpenTelemetry + Honeycomb to share. Let’s see what all the buzz is about this time! 🐝🐝

11 Best Redis Monitoring Tools [2022 Review]

Redis is an open-sourced, BSD 3 licensed, highly efficient in-memory data store that can be easily used as a distributed, in-memory key-value store, cache, or message broker. It is known for being extremely fast, reliable, and supporting a wide variety of data structures, making it a very versatile tool widely adopted across the industry. Redis was architectured with speed in mind and is designed in a way that it keeps all the data in memory.

Observability: You Can't Buy It, You Must Build It!

In Part 1 of this series, we talked about the origins of observability and why you need it. In this blog (Part 2), we will cover exactly what observability is, what it isn’t, and how to get started. Before we can dive into how to approach observability, let’s get one thing clear: You can’t buy a one-size-fits-all observability solution.

Debunking 4 Cybersecurity Myths About Machine Learning

Machine learning has infiltrated the world of security tooling over the last five years. That’s part of a broader shift in the overall software market, where seemingly every product is claiming to have some level of machine learning. You almost have to if you want your product to be considered a modern software solution. This is particularly true in the security industry, where snake oil salesmen are very pervasive and vendors typically aren’t asked to vigorously defend their claims.

Using Splunk Observability Cloud to Monitor Splunk RUM

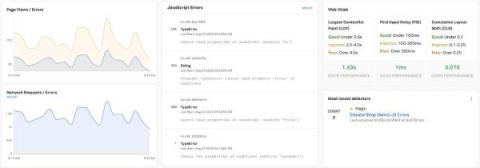
As a principal engineer on the Splunk Real User Monitoring (RUM) team who is responsible for measuring and monitoring our service-level agreements (SLAs) and service-level objectives (SLOs), I depend on observability to measure, visualize and troubleshoot our services. Our key SLA is to guarantee that our services are available and accessible 99.9% of the time.

Aggregations and Chains: Performance Measurement in Cribl Stream Pipelines

In this post, we’ll discuss two functions in the Cribl Stream arsenal: The Aggregations function, which allows you to perform stats and metrics collection in flight, and the Chain function allows you to call one Pipeline from within another. The event flow will continue when the Chained Pipeline returns. To demonstrate their use, we’ll answer this question: How long did it take for Cribl to process events using your pipeline?

How to monitor Couchbase with Google Cloud Ops

You can now easily monitor couchbase metrics and logs in Google Cloud. All of our logging and monitoring Google Cloud contributions are available through the Google Ops Agent GitHub repository. You can check it out here! The Google Ops Agent uses the built-in Prometheus exporter and receiver to monitor Couchbase sources running Couchbase 7.0. You can find documentation on the Prometheus exporter in the Couchbase documentation.