Operations | Monitoring | ITSM | DevOps | Cloud

Latest News

Interview With CTO, Leonard Trigg

For the next interview in our series speaking to technology specialists from around the world, we’ve welcomed experienced CTO, Leonard Trigg. Leonard is a member of the Harbourfront executive management team and serves as the firm's Chief Technology Officer. Joining the industry in 1995 Leonard has a background in enterprise technology, finance and operations. Leonard previously served as the Chief Operating Officer and Director at Vertex One Asset Management Inc.

Get more insights with the new version of the Node.js library

We’re thrilled to announce the release of a new update to the Cloud Logging Library for Node.js with the key new features of improved error handling and writing structured logging to standard output which becomes handy if you run applications in serverless environments like Google Functions!

AWS Service Observability using OpenTelemetry

Efficient use of observability statistics is essential to any microservice architecture. OpenTelemetry is a project supported by the Cloud Native Computing Foundation (CNCF) to enhance the observability of microservice projects. AWS Distro for OpenTelemetry (ADOT) is an AWS-supported distribution of the OpenTelemetry project specifically designed to improve the observability of AWS projects.

How Elastic powers speed, security, and connectivity in capital markets

Speed is everything in capital markets. Success in the front and back office is dependent on the ability to provide accurate, fast responses to challenging questions. Over the past several decades, there has been a tremendous increase in the amount of information available to market participants, and trade transactions are now being carried out at a very rapid pace. In parallel, the technology which capital markets firms are developing is becoming increasingly complex.

How to monitor MongoDB with OpenTelemetry

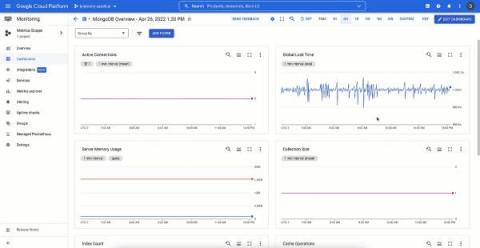
MongoDB is a document-oriented and cross-platform database that maintains its documents in the binary encoded JSON format. Mongo’s replication capabilities and horizontal capability using sharding make MongoDB highly available. An effective monitoring solution can make it easier for you to identify issues with MongoDB such as resource availability, execution slowdowns, and scalability. observIQ recently built and contributed a MongoDB metric receiver to the OpenTelemetry contrib repo.

Retrace Power User Tips and Tricks - Error and Log Management

The explosive growth of ecommerce has slowed in the last year. But the need for businesses to deliver a great digital user experience continues to grow. Companies that don’t rely on online customer purchases can still suffer blows to revenues due to a poor online experience. Market conditions are raising the importance of Application Performance Monitoring (APM) tools to ensure every digital interaction with your company is positive. APM tools vary by design, features and functionality.

Application logging with Flask

Without logs, or a good understanding of them, debugging an application or looking through an error stack trace can be challenging. Luckily, Flask logging can change the way you understand debugging and how you interact with logs produced by the application. The Flask logging module gives you a way to record errors over different severity levels. A default logging module is included in the Python standard library, and it provides both simple and advanced logging functions.

Benefits of Logging Agents

You probably have heard of logging agents, such as Logstash or Fluent Bit, if you’ve been investigating log analysis, monitoring, and observability. If so, and you’re wondering what logging agents are and why you might need them, you’ve come to the right place. This article will look at what logging agents are for, their advantages, and what you can use instead of a logging agent.