Operations | Monitoring | ITSM | DevOps | Cloud

Latest News

The Top 50 ELK Stack & Elasticsearch Interview Questions

If you are a candidate looking for your next role that involves an in-depth knowledge of Elasticsearch and the wider Elastic Stack then you will want to revise beforehand. In this resource guide on the top ELK interview questions, we've listed all of the leading questions that candidates are commonly asked about Elasticsearch, Logstash & Kibana (and their contemporary tools and plugins) alongside the answers. Want to improve your knowledge further?

How to Troubleshoot Apache Cassandra Performance Using Metrics and Logs in Debugging

In the era of data abundance, there exists a significant need for database systems that can effectively manage large quantities of data. For certain types of applications, an oft-considered option is Apache Cassandra. Like any other piece of software, however, Cassandra has issues that could potentially impact performance. When this happens, it’s critical to know where to look and what to look for in the effort to quickly restore service to an acceptable level.

A guide to deploying Grafana Loki and Grafana Tempo without Kubernetes on AWS Fargate

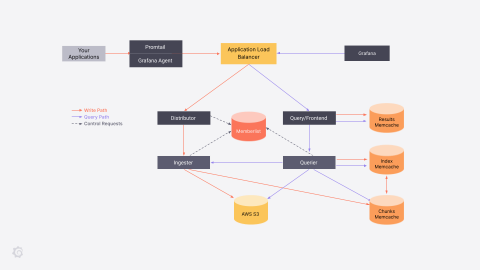
At Seniorlink, we provide services and technology to support families caring for their loved ones at home. In the past two years we’ve expanded our programs across the United States, and so our need to observe our application systems has grown too.

Read active log files more quickly and easily with the new filestream input in Filebeat

With Elastic 7.14, the filestream input, the successor of log input, is now generally available in Filebeat. This new, superior input provides better support for reading active log files, with faster reaction time when there is backpressure in the system, quicker registry updates, better cooperation with external log rotation tools, and more.

Making the LogDNA UI more accessible

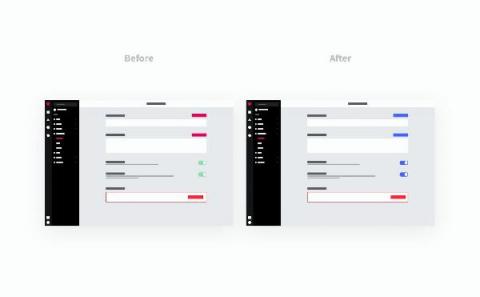
I’m Tim, a Product Design Manager at LogDNA and a massive coffee and magic enthusiast. My team is responsible for creating a beautiful and easy-to-navigate user interface so that you can easily access, and gain value from, your logs. We’ve been working on making our product more accessible and are about to roll out some subtle changes.

Logit.io To Double Down On Their Commitment To Transparent Pricing, No Data Egress Fees & Zero Vendor Lock-In

ELK based log management platform, Logit.io announced today their intention to further raise awareness of the importance of full transparency for cloud-native observability platforms in regards to billing, egress and zero vendor lock-in.

Archiving Is In, And Your Logs Are Here To Stay!

Archiving is in and your logs are here to stay! We develop features that streamline the log management processes for our users. Logs are information assets, and we understand that you need to retrieve, re-asses and draw insights from your historic logs. observIQ offers a simple integration with Amazon Web Services (AWS) for extended retention. It takes less than 30 seconds to set up and archive logs directly to an S3 bucket in your AWS account.

Troubleshoot GKE apps faster with monitoring data in Cloud Logging

When you’re troubleshooting an application on Google Kubernetes Engine (GKE), the more context that you have on the issue, the faster you can resolve it. For example, did the pod exceed it’s memory allocation? Was there a permissions error reserving the storage volume? Did a rogue regex in the app pin the CPU? All of these questions require developers and operators to build a lot of troubleshooting context.

Think you need a data lakehouse?

In our Data Lake vs Data Warehouse blog, we explored the differences between two of the leading data management solutions for enterprises over the last decade. We highlighted the key capabilities of data lakes and data warehouses with real examples of enterprises using both solutions to support data analytics use cases in their daily operations.