Operations | Monitoring | ITSM | DevOps | Cloud
Latest News
The Five Tenets of Observability
A new year is a chance to have a new start, and one thing that it’s a great opportunity to think about is the monitoring and observability platform you’re using for your applications. If you’ve been using a legacy monitoring system, you’ve probably heard about observability all over the ‘net and want to figure out if this is really something you need to care about.
Using Oracle Cloud as a Data Lake Made Simple With Cribl LogStream
All Cloud providers such as AWS, Azure, Google Cloud Platform, and Oracle Cloud offer Object Storage solutions to economically store large volumes of data and retrieve it on demand. It’s far cheaper to store one petabyte of data in object storage than in block storage. As AWS S3 has become the standard, many on-premise storage appliance vendors have incorporated S3 APIs to store and retrieve data. Oracle wisely continued that trend to OCI (Oracle Cloud Infrastructure).
How Reliability and Product Teams Collaborate at Booking.com
With more than 1.5M room nights booked per day, Booking.com requires a solid infrastructure that’s constantly monitored. And indeed, Booking.com now has a footprint of 50,000+ physical servers running across four data centers and six additional points of presence. The sheer size of this server fleet makes it viable for Booking.com to have dedicated teams specializing into looking only at the reliability of those servers.
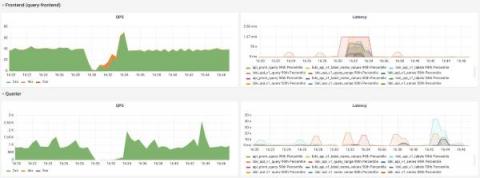
A (de)bug's life: Diagnosing and fixing performance issues in Grafana Loki's read path
Beep, beep, beeeeeeeep. Read path SLO page, again. And I’ve almost found the noisy neighbor! That was me. And will probably be me again at some point in the future. As we continue to scale up the team that builds and runs Grafana Loki at Grafana Labs, I’ve decided to record how I find and diagnose problems in Loki.
Top 10+ Best System Monitoring Software & Tools [2022 Comparison]
It’s virtually impossible to manage today’s complex IT environments at scale without a comprehensive system monitoring solution that allows you to check the health of all your applications and services from a single pane of glass. When your end users are experiencing difficulties, you must have such a tool in place that lets you quickly ascertain and remediate the root cause of the slowdown or error.
What are CDN Logs and Why Do They Matter
Content Delivery Network produces numerous log files called CDN logs to deliver video across the internet to our homes and mobile devices. These logs contain crucial information about the CDN servers' performance and video streaming quality. Also, it contains terabytes of data, which has its own set of hurdles in terms of handling it in real-time and performing analytics to understand user experience and network concerns.
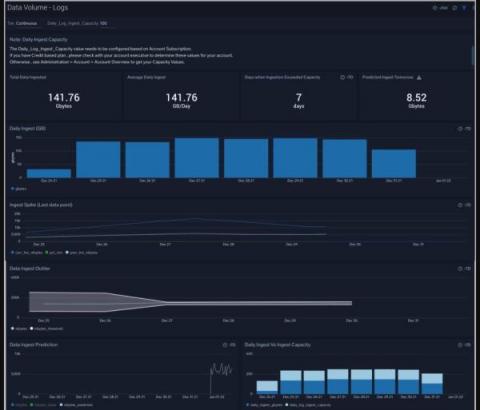
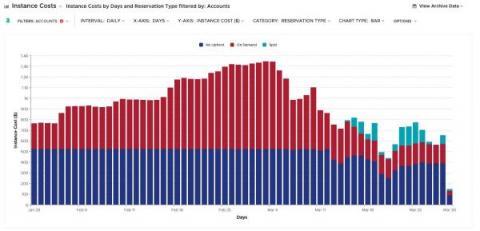
Monitoring AWS Spot instances using Sumo Logic
Kickstart your Splunk App with @Splunk/Create
I’ve been contributing to, and creating, Splunk apps for the better part of the last 10 years. But never have I felt more excited to be a Splunk Developer than right now. One of the primary reasons why I am so excited is because of build tools like @splunk/create. At Splunk, we recognize that developers are so crucial to our entire ecosystem.
How to save on your Azure Monitor and Log Analytics Costs
Thomas Stringer has a couple of great blog posts on how to understand your Azure monitoring costs and also on how to reduce your costs, see Azure Monitor Log Analytics too Expensive? Part 2 – Save Some Money | Thomas Stringer (trstringer.com). In the past I’ve blogged on How to calculate the Azure Monitor and Log Analytics costs associated with AVD (not an easy task!).


