Operations | Monitoring | ITSM | DevOps | Cloud

Latest News

Logit.io Featured On eChannelNews For New Partner Program Launch

We are excited to announce that Logit.io has recently been featured on e-ChannelNews where our founder Lee Smith was interviewed by the President of TechnoPlant, Julian Lee about our partner program. In this interview, Lee explains more about how the Logit.io platform can assist channel partners to grow their ability to offer enterprise-ready logging and metrics analysis.

How to Simplify Your Out-of-the-Box Alerting with NEW! AutoDetect

Over 85% of global organizations will be running containerized applications in production by 2025 say Gartner, with 4 in 5 enterprises expected to move their workloads from on-premises infrastructure to the cloud. Migration to the cloud has IT admins and/or SREs managing an increasingly complex, hybrid IT environment, with an uphill battle of trying to monitor and troubleshoot their infrastructure components and services in real time.

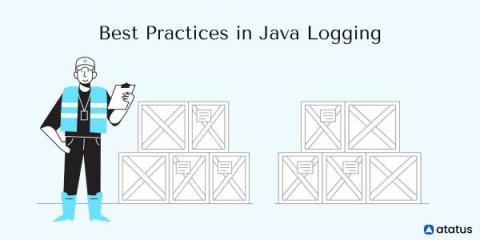
Best Practices in Java Logging for Better Application Logging

Examining Java logs is usually the quickest way to figure out why your application is experiencing trouble, so it's critical to have it in place. Best practices for Java logging can help you troubleshoot and address issues before they affect your users or business. In many circumstances, this entails utilizing a Java logging tool capable of automating your processes and delivering faster and more accurate results than manual logging.

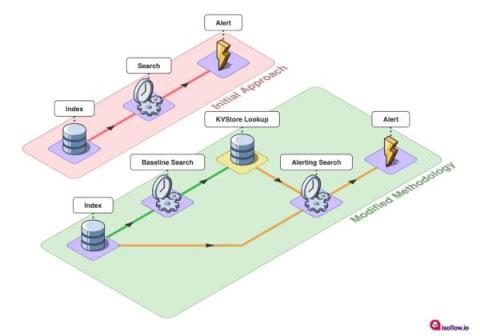
A Splunk Approach to Baselines, Statistics and Likelihoods on Big Data

A common challenge that I see when working with customers involves running complex statistics to produce descriptions of the expected behaviour of a value and then using that information to assess the likelihood of a particular event happening. In short: we want something to tell us, "Is this event normal?". Sounds easy right? Well; Sometimes yes, sometimes no. Let's look at how you might answer this question and then dive into some of the issues it poses as things scale-up.

3 Ways LogStream Can Improve Your Data Agility

Four months into this new gig at Cribl, I wish I could bottle up that “lightbulb” moment I get when walking people through how Cribl LogStream can help them gain better control of their observability data. So I hope the scenario walkthroughs below will capture some of that magic and shed some light on how LogStream can improve your organization’s data agility – helping you do more with your data, quickly, and with less engineering resources.

What's New at observIQ

You may have noticed a few changes around here. If you explore our new website, you’ll notice new products, expansions to our open source libraries, significant contributions to our favorite open source project, OpenTelemetry, and new integrations with Google Cloud. You might just think we’re taking “new year new me” a little too seriously, but in fact we’ve been planning some of these changes for a long time. It all stems from our firm belief in open source technology.

Prevent Data Downtime with Anomaly Detection

A couple months ago, a Splunk admin told us about a bad experience with data downtime. Every morning, the first thing she would do is check that her company’s data pipelines didn’t break overnight. She would log into her Splunk dashboard and then run an SPL query to get last night’s ingest volume for their main Splunk index. This was to make sure nothing looked out of the ordinary.

Feature Spotlight: Centralized Log Collection

Speedscale is proud to announce its Centralized Log Collection capability. When diagnosing the source of problems in your API, more information is better. For most engineers, the diagnosis process usually starts with the application logs. Unfortunately, logs are usually either discarded or stored in Observability systems that engineers don’t have direct access to. Compounding this issue is that the log information is typically not correlated to what calls were made against the API.