Operations | Monitoring | ITSM | DevOps | Cloud

Latest News

Running Telegraf as Serverless on AWS Lambda for Monitoring Your Cloud

Telegraf is one of the coolest open source agents for collecting metrics. It’s part of the TICK Stack (Telegraf, Influx, Chronograf and Kapacitor) and with Telegraf you can collect metrics from a wide array of inputs and write them into a wide array of outputs. It is plugin-driven for both collection and output of data so it is easily extendable.

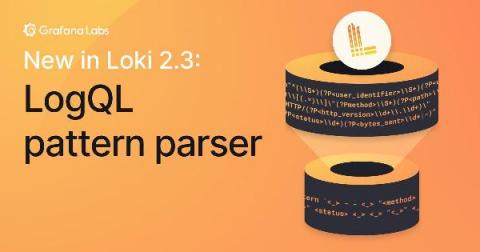
New in Loki 2.3: LogQL pattern parser makes it easier to extract data from unstructured logs

Writing LogQL queries to access Loki’s log data just got easier, thanks to the new pattern parser released with Loki 2.3. It makes writing queries for unstructured log formats simple. And the pattern parser can be an order of magnitude faster than the regular expression parser. Let’s take a closer look.

Use log buckets for data governance, now supported in 23 regions

Logs are an essential part of troubleshooting applications and services. However, ensuring your developers, DevOps, ITOps, and SRE teams have access to the logs they need, while accounting for operational tasks such as scaling up, access control, updates, and keeping your data compliant, can be challenging. To help you offload these operational tasks associated with running your own logging stack, we offer Cloud Logging.

The Evolving World of GitOps and Observability

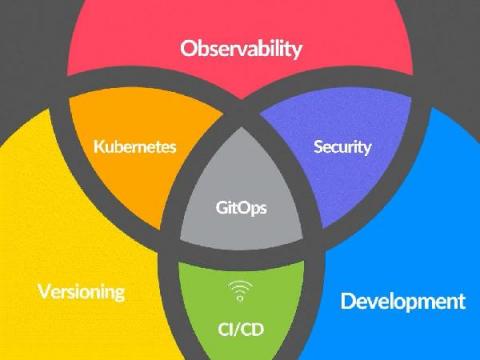
Is GitOps changing observability as we know it? GitOps has been the buzz word in the DevOps space for several years. GitOps, to those that are not familiar, is an operational methodology for DevOps that leverages a continuous deployment approach with Git as the single source of ‘truth’ for declarative control over both infrastructure and applications.

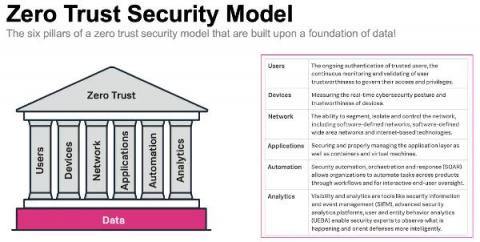
A Zero Trust Security Approach for Government: Increasing Security but also Improving IT Decision Making

Public sector organisations are in the middle of a massive digital transformation. Technology advances like cloud, mobile, microservices and more are transforming the public sector to help them deliver services as efficiently as commercial businesses, meet growing mission-critical demands, and keep up with market expectations and be more agile.

How to Monitor Redis Logs and Metrics

With a multitude of digital options available in almost every industry, it’s become increasingly critical that applications and services provide a positive user experience. Doing so requires a high level of availability, made possible (in part) by efficiently identifying and resolving issues with the system, when they occur. To achieve this, monitoring all critical components of an application and its infrastructure is a necessity.

New histogram features in Cloud Logging to troubleshoot faster

Visualizing trends in your logs is critical when troubleshooting an issue with your application. Using the histogram in Logs Explorer, you can quickly visualize log volumes over time to help spot anomalies, detect when errors started and see a breakdown of log volumes. But static visualizations are not as helpful as having more options for customization during your investigations.

Elastic recognized for innovation by Google Cloud and Microsoft

Elastic received honors from two key partners, Microsoft and Google — a recognition of our efforts to ensure that customers can easily find and use Elastic products in the environments that best suit their needs. Elastic was named the 2021 Microsoft US Partner Award Winner in Business Excellence in the Commercial Marketplace. In addition, for the second year in a row, Elastic was selected by Google Cloud as the 2020 Technology Partner of the Year for Data Management.