Operations | Monitoring | ITSM | DevOps | Cloud
Latest News
How Operators Build Operational Excellence with Modern Data Platforms Splunk
Enhancing the customer experience and boosting revenue with the power of analytics are key concepts for telecom operators in today’s ultra-competitive business environment. Many telecoms are going through transformation of their system architectures and stacks to change how they operate and manage their day to day operations as well as their strategies and planning for what comes next.
Smarter Root Cause Analysis: Determining Causality from your ITSI KPIs
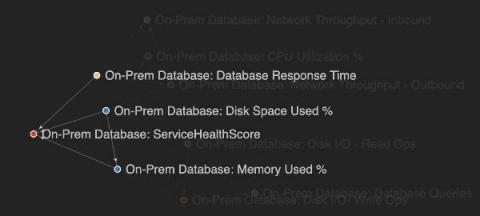
Root cause analysis can be a difficult challenge when you are troubleshooting complex IT systems. In this blog, we are going to take you through how you can perform root cause analysis on your IT Service Intelligence (ITSI) episodes using machine learning, or more specifically causal inference. The approach shown here is included in the Smart ITSI Insights app for Splunk, with this blog largely detailing how to use the ITSI Episode Analysis dashboard.
Why Cisco embraces Elastic for IT infrastructure transparency
This post is a recap of a presentation given at ElasticON 2020. Interested in seeing more talks like this? Check out the conference archive. Network infrastructure is the engine that drives a company’s business. As companies scale, assets that compose this infrastructure become more complex to manage. That means there’s more hardware, more software, and more subscriptions and services that require tracking.
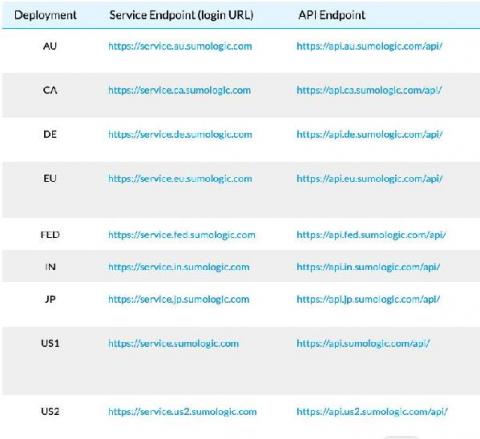
Sumo Logic Achieves FedRAMP-Moderate Authorization
Automating the potential workflows with Sumo Logic APIs
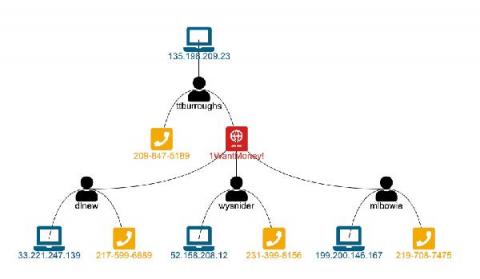
Visual Link Analysis with Splunk: Part 2 - The Visual Part
In part one of the "Visual Analysis with Splunk" blog series, "Visual Link Analysis with Splunk: Part 1 - Data Reduction," we covered how to take a large data set and convert it to only linked data in Splunk Enterprise. Now let’s look at how we can start visualizing the data we found that contains links. Why, you may ask, when we just developed a nice table of data that shows us links? Tables of data don’t always work well if you have more than one page of data.
AWS Distro for OpenTelemetry - Now with Splunk Observability Support!
Back in October, we announced the Splunk OpenTelemetry Collector Distribution, which offered the industry’s first production-ready support for OpenTelemetry. This distribution is the recommended way that customers of Splunk’s award-winning observability products capture metrics and traces.
Data lifecycle management with data tiers
Elasticsearch 7.10 made configuring the lifecycle of your data less complicated. In this blog post I’ll walk through some of the changes, how to use them, and some best practices along the way. Data lifecycle can encompass a lot of stages, so we’ll touch on.
Monitoring Microsoft 365 User Experience using Microsoft Graph
Understanding the Graph API’s architecture and value in standard monitoring scenarios.


