Operations | Monitoring | ITSM | DevOps | Cloud

Latest News

Sentry for Spring Boot & Logback

While Spring Boot provides everything developers need build applications, it leaves operational aspects of debugging issues to the developers and third-party services. If up until now all you had was log aggregation, where you can browse and filter through a web UI, prepare to have your mind blown with Sentry’s automatic error grouping, alerting, breadcrumbs, and much more. Sentry has recently launched a major update to the Java SDK. In the post, we’ll focus on Spring Boot and Logback.

Using rKubeLog Collector for Aggregated Log Centralization

Debugging and resolving incidents in nodeless environments can be difficult, time-consuming, and most of all, frustrating. Exporting your logs from these ephemeral and disparate services to a centrally aggregated log is a great way to correlate information, quickly resolve incidents, and make your life a little easier.

How to analyze IIS logs for better monitoring

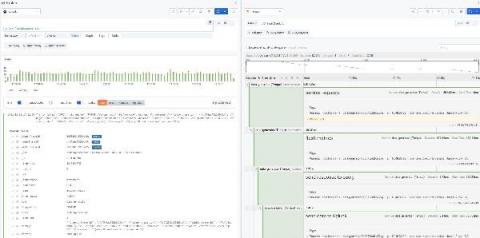
Log analysis helps organizations determine the best way to optimize application functionality while giving development teams a leg up in root cause analysis. With that said, it’s not feasible to scroll through thousands of lines of log entries in a text editor. Instead, development teams need modern tools that enable them to centralize, filter, and analyze their logs in a way that allows them to glean valuable insights in a time-efficient manner.

Event Log Management for Security and Compliance

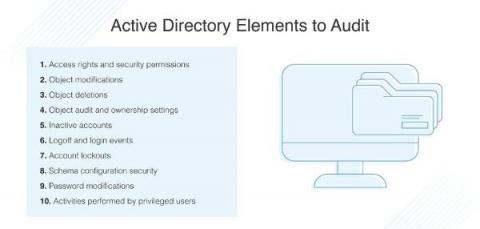
Security log management is the process of collecting, storing, and correlating the network data that details all activity in your systems and networks. Every action in an organization’s network generates event data, including records produced by operating systems, applications, devices, and users. The Center for Internet Security (CIS) identifies log management as a basic control for detecting malicious actors and software hiding in networks and on machines.

Integrating TA-Nix with Splunk App for Infrastructure

Previous articles in our series have introduced the Splunk App for Infrastructure (SAI) and provided getting-started guidance for Linux and Windows using native metric-collection tools such as collectd and perfmon. But did you know you can also use your existing Splunk Universal Forwarders (UF’s), together with the Splunk Add-on for Unix and Linux (TA-Nix) to send both the metrics and logs without the need of additional agents?

Jaeger Essentials: Distributed Tracing from Dapper to Jaeger

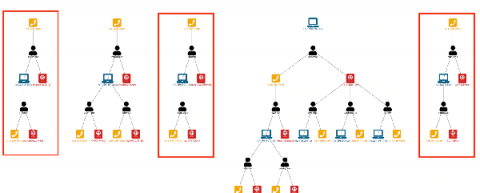
If you are dealing with microservices, serverless architecture, on any other type of distributed architecture, you have probably heard the term “Distributed Tracing.” You may have been wondering what it’s all about, and where should you start, in this post, I’ll tell you about the journey we passed at Duda, from the day we heard about distributed tracing and started to explore whether it will be useful to use it in our company, to the exploration on what is distributed tracing a

5 Things to Know When Choosing Open Source SIEM Tools

Security Information and Event Management (SIEM) tools focus on insights into IT environments and tracking records of all their operations. These IT environments can be application infrastructures, physical networks, and cloud networks. SIEM initially evolved from the log management discipline, which involved integrating security events with security information to collect, analyze, and report on activities in networks.

Exciting new features of Coralogix STA

We at Coralogix, believe that cloud security is not a “nice-to-have” feature – something that only large organizations can benefit from or are entitled to have. We believe it’s a basic need that should be solved for organizations of any shape and size. This is why we built the Coralogix Security Traffic Analyzer (STA) tool for packet sniffing and automated analysis. Today we’re announcing several new features to our security product you’ll find interesting.

Solving Microservices Connectivity Issues with Network Logs

The network is foundational to distributed application environments. A distributed application has multiple microservices, each running in a set of pods often located on different nodes. Problem areas in a distributed application can be in network layer connectivity (think network flow logs), or application resources unavailability (think metrics), or component unavailability (think tracing).

Aggregate all the things: New aggregations in Elasticsearch 7

The aggregations framework has been part of Elasticsearch since version 1.0, and through the years it has seen optimizations, fixes, and even a few overhauls. Since the Elasticsearch 7.0 release, quite a few new aggregations have been added to Elasticsearch like the rare_terms, top_metrics or auto_date_histogram aggregation. In this blog post we will explore a few of those and take a closer look at what they can do for you.