Operations | Monitoring | ITSM | DevOps | Cloud
Latest News
Not Another New Year's Resolution
I hope I’m not alone in starting 2021 with some sense of optimism. While several hard months remain ahead of us, I am hopeful and also expecting that some sense of normality will return by the summer months. Either way, this gives us an opportunity to reflect on the challenges we have faced. 2020 was testing. We learnt a lot about ourselves and our businesses in the most challenging of circumstances.
Kick off 2021 by learning Elastic solutions with free 15-minute guides
Elastic solutions solve many different business challenges from powering search bars to creating observable systems to detecting and responding to threats. And with the amount of capabilities each offers, learning how to maximize the power of our solutions for enterprise search, observability, and security is critical to realizing Elastic's full value. But finding the time to build new skills can be challenging.
How to get started quickly with metrics, logs, and traces using Grafana Cloud integrations
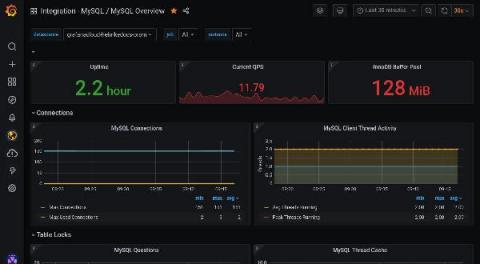
Grafana Cloud is the easiest way to get started observing metrics, logs, traces, and dashboards. When we say “easiest,” we mean it: Grafana Cloud is designed so that even novice observability users can use it. As a new user, you are not required to dive into the complexity of setting up Prometheus and figuring out how to create Grafana dashboards from scratch. Integrations are the reason why.
The new Grafana Cloud: the only composable observability stack for metrics, logs, and traces, now with free and paid plans to suit every use case
Oftentimes users of open source are told to go download it and figure it out… or pay for a managed solution in the cloud. So the typical choice is free and do-it-yourself or expensive and easy. With our new changes to Grafana Cloud, we are making it both free and easy to have a real, composable observability solution.
A Practical Guide to Logstash: Syslog Deep Dive
Syslog is a popular standard for centralizing and formatting log data generated by network devices. It provides a standardized way of generating and collecting log information, such as program errors, notices, warnings, status messages, and so on. Almost all Unix-like operating systems, such as those based on Linux or BSD kernels, use a Syslog daemon that is responsible for collecting log information and storing it.
Improve Your Security Posture By Focusing on Velocity, Visibility, and Vectors
Yes, Virginia, There is a -Santa Claus- Way to Detect Unemployment Fraud
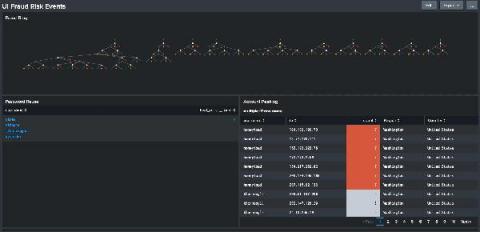
Fraud rates for Unemployment Insurance Benefits (UIB) and Pandemic Unemployment Assistance (PUA) are out of control. In May 2020, Brian Krebs of Krebsonsecurity published two articles detailing fraud that was occurring in several different state’s UIB portals. These states had been warned by the US Secret Service to be on the lookout for this. Reading the articles, the common theme is that many states are missing rudimentary controls for combating fraud.
Recapping Re:Invent 2020
As with many things in 2020, this year’s AWS re:Invent was quite different from any previous iterations. For starters, instead of a week of live talks, face-to-face sessions, and a room full of booths, this year the event was fully online and stretched out for three weeks. As sponsors of this year’s event, we were excited to participate and continue to make an impact on the AWS community.
How to use LogQL range aggregations in Loki
In my ongoing Loki how-to series, I have already shared all the best tips for creating fast filter queries that can filter terabytes of data in seconds and how to escape special characters. In this blog post, we’ll cover how to use metric queries in Loki to aggregate log data over time.


