Operations | Monitoring | ITSM | DevOps | Cloud

Latest News

Getting Started with Java & OpenTelemetry

It’s easy to get started with Java and Honeycomb using OpenTelemetry. With Honeycomb being a big supporter of the OpenTelemetry initiative, all it takes is a few parameters to get your data in. In this post, I will walk through setting up a demo app with the OpenTelemetry Java agent and show how I was able to get rich details with little work by combining automatic instrumentation from the agent with custom instrumentation in the code.

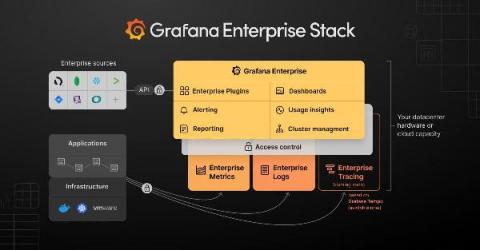
Introducing Grafana Enterprise Logs, a core part of the Grafana Enterprise Stack integrated observability solution

Today, we are launching a new Grafana Labs product, Grafana Enterprise Logs. Powered by the Grafana Loki open source project for cloud native log aggregation, and built by the maintainers of the project, this offering is an exciting addition to our growing self-managed observability stack tailored for enterprises.

How to monitor Amazon ECS with Elastic Observability

With an increasing number of organizations migrating their applications and workloads to containers, the ability to monitor and track container health and usage is more critical than ever. Many teams are already using the Metricbeat docker module to collect Docker container monitoring data so it can be stored and analyzed in Elasticsearch for further analysis. But what happens when users are using Amazon Elastic Container Service (Amazon ECS)? Can Metricbeat still be used to monitor Amazon ECS? Yes!

What Is Apdex and How Can It Help Monitor App Health?

VMware recently announced that Apdex is now available in Tanzu Observability by Wavefront. Users can access it by selecting Apdex when viewing the application status page. Apdex is a “numerical measure of user satisfaction with the performance of enterprise applications," according to the Apdex Alliance website. Similar to how request, error, and duration (RED) metrics measure the health of a service, we can use Apdex to score response time based upon a self-defined target.

Istio monitoring with Elastic Observability

Istio is an open source service mesh that can be used by developers and operators to successfully control, secure, and connect services together in the world of distributed microservices. While Istio is a powerful tool for teams, it's also important for administrators to have full visibility into its health. In this blog post, we'll take a look at monitoring Istio and its microservices with Elastic Observability. As the Istio docs mention.

A Day in the Life: Intelligent Observability at Work with DevOps

Thursday morning, and I’ve done some yoga, a ten-minute meditation and am at my desk in my hastily thrown up garden office with a mug of green tea by 08:30am. I’m really not missing the commute to our old HQ (now permanently closed, thanks to the pandemic) in the heart of Seattle and am enjoying an extra few minutes in bed and getting mindful before logging in.

On Not Being a Cog in the Machine

This is my first week here as the first dedicated SRE for Honeycomb, and in a welcoming gesture, I was asked if I wanted to write a blog post about my first impressions and what made me decide to join the team. I’ve got a ton of personal reasons for joining Honeycomb that may not be worth being all public about, but after thinking for a while, I realized that many of the things I personally found interesting could point towards attitudes that result in better software elsewhere.

Observability vs. Monitoring in DevOps

If you strip the buzzwords and TLAs from the definition of DevOps? You’ll find that the roles and tasks involved aim mostly for more uptime and less downtime in the SDLC (software development lifecycle). The first step to achieving that is becoming aware of downtime as it happens with the help of monitoring solutions. Only then can you respond and resolve the issue in a timely manner that minimizes the dreaded and expensive downtime of software development teams.

Monitoring as code: what it is and why you need it

“Everything as code” has become the status quo among leading organizations adopting DevOps and SRE practices, and yet, monitoring and observability have lagged behind the advancements made in application and infrastructure delivery. The term “monitoring as code” isn’t new by any means, but incorporating monitoring automation as part of an infrastructure as code (IaC) initiative is not the same as a complete end-to-end solution for monitoring as code.

Honeycomb Raises $20M to Define the Future of Observability

I’m delighted to announce that Honeycomb has raised $20M in Series B funding, led by e.ventures Growth, with participation from existing investors Scale Venture Partners, Storm Ventures, Next World Capital, and Merian Ventures, and joined by Industry Ventures. Honeycomb has led the conversation and momentum behind observability for years, and now we’re poised to scale the product, community, and practice even further.