Operations | Monitoring | ITSM | DevOps | Cloud

Latest News

Monitoring, Observability, & Debuggability Explained

Monitoring tools are great at letting you know when something is broken and the overall impact. We should know, we make an error monitoring tool. Observability tools are good for well, observing. But here’s the thing, you (we) don’t observe code. We (you) push code. So what the collective “we” need is a tool that makes it easy to ship, improve, and maintain reliable and performant code.

Making Room for Some Lint

It’s one of my strongly held beliefs that errors are constructed, not discovered. However we frame an incident’s causes, contributing factors, and context ends up influencing the shape of the corrective items (if any) that get created. I’ll cover these ideas by using our June 3rd incident where a database migration caused a large outage by locking up a shared database and making it run out of connections.

Elastic vs Splunk [Detailed Comparison 2024]

Elasticsearch and Splunk are two leading solutions renowned for their capabilities in processing, analyzing, and visualizing large datasets in real-time. Both platforms have carved out significant roles in the fields of data analytics and log management, each offering unique features tailored to different needs. This article aims to provide a comprehensive comparison of Elasticsearch and Splunk, highlighting their strengths and weaknesses, and introducing Uptrace as a compelling alternative.
Sponsored Post

What's new in Avantra 24.2

It's my pleasure to announce the release of Avantra 24.2. The second update of Avantra 24, building upon 24.1 which brought performance and customer requested bug fixes, 24.2 brings new innovations and enhancements to our Avantra platform. With over 300 changes in our development management system, Avantra 24.2 feels like a major release to us and we have something new everywhere you look. Let's dive deeper into the new features.

Why Your Telemetry(Observability) Pipelines Need to be Responsive

At Mezmo, we consider Understand, Optimize, and Respond, the three tenets that help control telemetry data and maximize the value derived from it. We have previously discussed data Understanding and Optimization in depth. This blog discusses the need for responsive pipelines and what it takes to design them.

How Network Observability Helps Lay the Foundation of Autonomous IT Operations

We often hear the term "observability" in the context of DevOps and how SREs use telemetry data. Collecting and analyzing this telemetry data is a vital first step to a successful autonomous IT operations strategy. Observability can help you find out about problems in your system you didn’t know you had—and before your users are impacted—by giving you new visibility that your monitoring systems don’t provide. But any observability initiative must also include network observability.

The CoPE and Other Teams, Part 1: Introduction & Auto-Instrumentation

The CoPE is made to affect, meaning change, how things work. The disruption it produces is a feature, not a bug. That disruption pushes things away from a locally optimal, comfortable state that generates diminishing returns. It sets things on a course of exploration to find new terrains which may benefit it more—and for longer.

Making The Case for Continuous Observability

Software complexity grows exponentially, developer efficiency grows far slower. And debugging often takes up 20-50% of development time. More complex, connected systems means increased data flow at the edge, and in the cloud. That leads to increased exposure to vulnerabilities, cyber threats, malfunctions, and bugs with risks that are hard to assess.

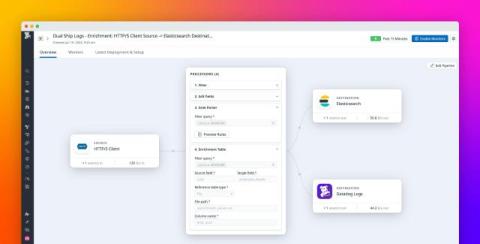
Transform and enrich your logs with Datadog Observability Pipelines

Today’s distributed IT infrastructure consists of many services, systems, and applications, each generating logs in different formats. These logs contain layers of important information used for data analytics, security monitoring, and application debugging. However, extracting valuable insights from raw logs is complex, requiring teams to first transform the logs into a well-known format for easier search and analysis.

Get granular LLM observability by instrumenting your LLM chains

The proliferation of managed LLM services like OpenAI, Amazon Bedrock, and Anthropic have introduced a wealth of possibilities for generative AI applications. Application engineers are increasingly creating chain-based architectures and using prompt engineering techniques to build LLM applications for their specific use cases.