Operations | Monitoring | ITSM | DevOps | Cloud

Latest News

Incident Review: What Comes Up Must First Go Down

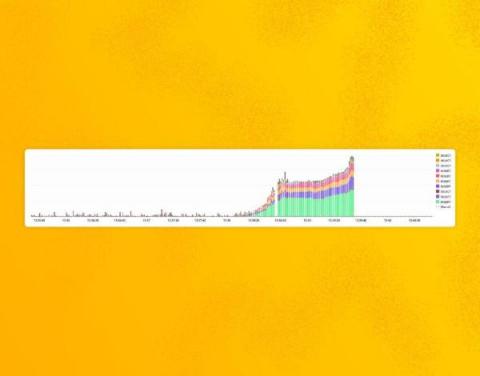
On July 25th, 2023, we experienced a total Honeycomb outage. It impacted all user-facing components from 1:40 p.m. UTC to 2:48 p.m. UTC, during which no data could be processed or accessed. This outage is the most severe we’ve had since we had paying customers. In this review, we will cover the incident itself, and then we’ll zoom back out for an analysis of multiple contributing elements, our response, and the aftermath.

Calculating Sampling's Impact on SLOs and More

What do mall food courts and Honeycomb have in common? We both love sampling! Not only do we recommend it to many of our customers, we do it ourselves. But once Refinery (our tail-based sampling proxy) is set up, what comes next? Since sampling is inherently lossy, it’s good to be sure the organization’s most important measurements aren’t negatively affected.

Why Observability Architecture Matters in Modern IT Spaces

Observability architecture and design is becoming more important than ever among all types of IT teams. That’s because core elements in observability architecture are pivotal in ensuring complex software systems’ smooth functioning, reliability and resilience. And observability design can help you achieve operational excellence and deliver exceptional user experiences. In this article, we’ll delve into the vital role of observability design and architecture in IT environments.

Grafana Pyroscope 1.0 release: continuous profiling for a modern open source observability stack

When we launched Pyroscope in 2021, we had one clear goal: Give developers a powerful open source continuous profiling tool for collecting, storing, and analyzing profiling data. Grafana Labs had a similar goal when they released Grafana Phlare, a horizontally scalable, highly available open source profiling solution inspired by databases like Grafana Loki, Grafana Mimir, and Grafana Tempo.

How to deploy Hello World Elastic Observability on Google Cloud Run

Elastic Cloud Observability is the premiere tool to provide visibility into your running web apps. Google Cloud Run is the serverless platform of choice to run your web apps that need to scale up massively and scale down to zero. Elastic Observability combined with Google Cloud Run is the perfect solution for developers to deploy web apps that are auto-scaled with fully observable operations, in a way that’s straightforward to implement and manage.

Advanced Monitoring and Observability Tips for Kubernetes Deployments

Cloud deployments and containerization let you provision infrastructure as needed, meaning your applications can grow in scope and complexity. The results can be impressive, but the ability to expand quickly and easily makes it harder to keep track of your system as it develops. In this type of Kubernetes deployment, it’s essential to track your containers to understand what they’re doing.

When Two Worlds Collide: AI and Observability Pipelines

In today's data-driven world, ensuring the stability and efficiency of software applications is not just a need but a requirement. Enter observability. But as with any evolving technology, there's always room for growth. That growth, as it stands today, is the convergence of artificial intelligence (AI) with observability pipelines. In this blog, we'll explore the idea behind this merge and its potential.

Comparing Six Top Observability Software Platforms

When it comes to observability, your organization will have no shortage of options for tools and platforms. Between open source software and proprietary vendors, you should be able to find the right tools to fit your use case, budget and IT infrastructure. Observability should be cost-efficient, easy to implement and customers should be provided with the best support possible.

Honeycomb + Tracetest: Observability-Driven Development

Our friends at Tracetest recently released an integration with Honeycomb that allows you to build end-to-end and integration tests, powered by your existing distributed traces. You only need to point Tracetest to your existing trace data source—in this case, Honeycomb. This guest post from Adnan Rahić walks you through how the integration works.