Operations | Monitoring | ITSM | DevOps | Cloud

Latest News

Reducing Mean Time to Diagnosis: How Salary Finance Uses Honeycomb to Ask the Right Questions

Salary Finance is a UK-based financial well-being employee benefit program. Over the last seven years, the company grew from a startup to a scaleup, earning rave reviews along the way from its more than 4,000 customers. However, with fast growth also comes natural growing pains. As their customer base expanded, so did the number of incidents they experienced, which also became harder to diagnose due to lack of visibility into their increasingly complex environment.

Managing your applications on Amazon ECS EC2-based clusters with Elastic Observability

In previous blogs, we explored how Elastic Observability can help you monitor various AWS services and analyze them effectively: One of the more heavily used AWS container services is Amazon ECS (Elastic Container Service). While there is a trend toward using Fargate to simplify the setup and management of ECS clusters, many users still prefer using Amazon ECS with EC2 instances.

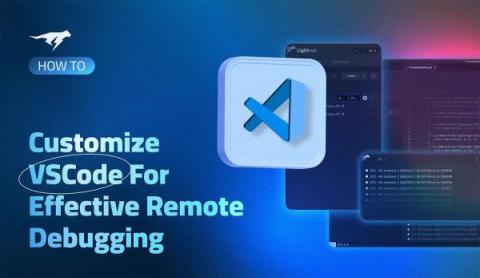
Effective Remote Debugging with VS Code

This post will discuss remote debugging in VS Code and how to improve the remote debugging experience to maximize debugging productivity for developers. Visual Studio Code, or VS Code, is one of the most popular IDEs. Within ten years of its initial release, VS Code has garnered the top spot among popularity indices, and its community is growing steadily. Developers love VS Code not only for its simplicity but also due to its rich ecosystem of extensions, including the support for debugging.

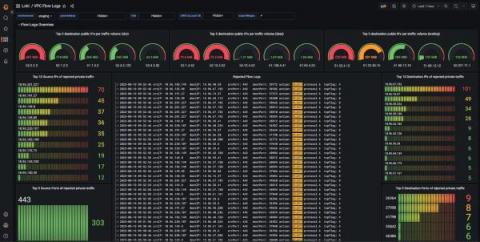
How Qonto used Grafana Loki to build its network observability platform

Christophe is a self-taught engineer from France who specializes in site reliability engineering. He spends most of his time building systems with open-source technologies. In his free time, Christophe enjoys traveling and discovering new cultures, but he would also settle for a good book by the pool with a lemon sorbet.

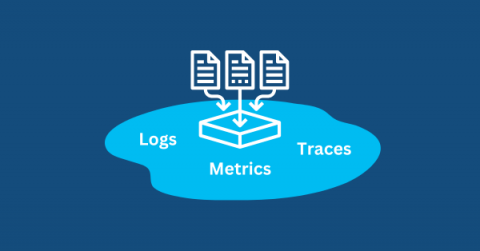
Splashing into Data Lakes: The Reservoir of Observability

If you’re a systems engineer, SRE, or just someone with a love for tech buzzwords, you’ve likely heard about “data lakes”. Before we dive deep into this concept, let’s debunk the illusion: there aren’t any floaties or actual lakes involved! Instead, imagine a vast reservoir where you store loads and loads of raw data in its natural format. Now, pair this with the idea of observability and telemetry pipelines, and we have ourselves an engaging topic.

Free Jaeger Alternatives [comparison 2023]

Jaeger, a renowned distributed tracing system, has been a trusted companion for developers and operations teams seeking to unravel the complexities of microservices architectures. However, as the landscape continues to evolve, the time has come to explore Jaeger alternatives that offer distinct features and advantages.

Three Code Instrumentation Patterns To Improve Your Node.js Debugging Productivity

In this age of complex software systems, code instrumentation patterns define specific approaches to debugging various anomalies in business logic. These approaches offer more options beyond the built-in debuggers to improve developer productivity, ultimately creating a positive impact on the software’s commercial performance. In this post, let’s examine the various code instrumentation patterns for Node.js.

Unify your observability signals with Grafana Cloud Profiles, now GA

Observability has traditionally been conceptualized in terms of three core facets: logs, metrics, and traces. For years, these elements have been seen as the “pillars” of observability, serving as the foundational components for system monitoring and delivering key insights to improve system performance. However, with the exponential growth in system complexity, a more comprehensive and unified perspective on observability has become necessary.

Mainframe Observability with Elastic and Kyndryl

As we navigate our fast-paced digital era, organizations across various industries are in constant pursuit of strategies for efficient monitoring, performance tuning, and continuous improvement of their services. Elastic® and Kyndryl have come together to offer a solution for Mainframe Observability, engineered with an emphasis on organizations that are heavily reliant on mainframes, including the financial services industry (FSI), healthcare, retail, and manufacturing sectors.