Operations | Monitoring | ITSM | DevOps | Cloud

Latest News

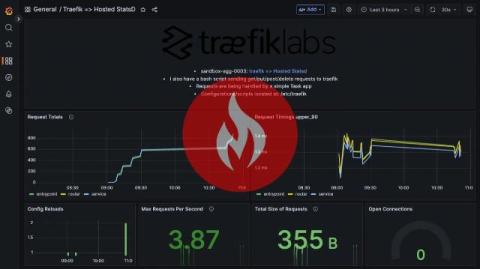
Easiest Way to Monitor Traefik Requests Using StatsD and Graphite

Traefik is a modern reverse proxy and load balancer designed to handle dynamic, microservices-based environments with ease. It's popular for its simple configuration, native integration with cloud platforms, and ability to automatically discover services in real time. Monitoring Traefik is essential to ensure efficient traffic management, gain insights into service performance, and quickly detect issues, making it a vital component in maintaining reliable, high-performance applications.

Enhance your website and internet service performance with a detailed RCA report

Without visibility into webpage performance metrics, organizations risk encountering several critical challenges. These challenges include slow load times deterring potential customers, difficulty in troubleshooting performance bottlenecks, inefficient resource allocation, missed opportunities for optimization, and a damaged brand reputation due to poor user experience.

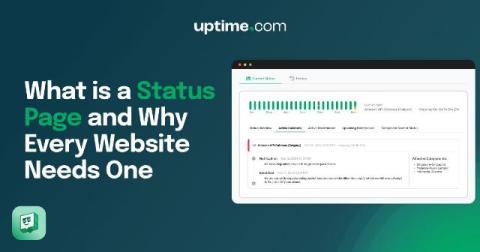
What is a Status Page and Why Every Website Needs One

Imagine if every time your website had the hiccups, your customers started dialing support faster than you can say “downtime.” In the modern digital age, where patience is thinner than a smartphone and attention spans are shorter than a tweet, keeping your users informed is not just polite — it’s essential. So, what exactly is a status page? Think of it as your company’s health monitor, but without the awkward blood pressure cuff.

Top 12 SolarWinds Competitors and Alternatives In 2024

Organizations exploring SolarWinds alternatives often face a critical decision when choosing the right network and infrastructure monitoring solution. While SolarWinds has established itself as a reliable industry standard, companies are increasingly seeking alternatives that offer better alignment with their monitoring needs, budget constraints, and security requirements.

Did Delta's slow web performance signal trouble before CrowdStrike?

The CrowdStrike outage was a reminder of how quickly the dominoes can fall—especially when the foundation is shaky. Delta Airlines was hit harder than its competitors. While United and American Airlines were able to recover within days, Delta faced ongoing struggles, leading to the cancellation of 7,000 flights over five days.

Tracing the Line: Understanding Logs vs. Traces

In the software space, we spend a lot of time defining the terminology that describes our roles, implementations, and ways of working. These terms help us share fundamental concepts that improve our software and let us better manage our software solutions. To optimize your software solutions and help you implement system observability, this blog post will share the key differences between logs vs traces.

Common Kafka Cluster Management Pitfalls and How to Avoid Them

Managing a Kafka cluster is no small feat. While Kafka’s distributed messaging system is incredibly powerful, keeping it running smoothly takes careful planning and a keen eye on the details. Small mistakes in Kafka management can quickly add up, leading to bottlenecks, unexpected downtime, and overall reduced performance. Let’s explore some common Kafka management pitfalls and, more importantly, how to steer clear of them.

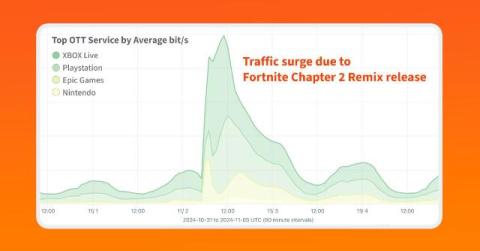
Anatomy of an OTT Traffic Surge: The Fortnite Chapter 2 Remix Update

On Saturday, November 2, the wildly popular video game Fortnite released its latest game update: Fortnite Chapter 2 Remix. The result was a surge of traffic as gaming platforms around the world downloaded the latest update for the seven-year-old game. Doug Madory looks at how the resulting traffic surge can be analyzed using Kentik’s OTT Service Tracking.

Monitoring domains and DNSSEC properly

First of all, if you own a domain, the following text is for you. In production you obviously want to reduce outages. And an outage of a DNS domain as such takes down all services under that domain, no matter whether your LAMP components are all up and running. At least from users’ perspective. As usually, roughly speaking, monitoring has to “play end user” to properly discover failures end-to-end. At best you have an Icinga satellite (e.g.