Operations | Monitoring | ITSM | DevOps | Cloud

Latest News

Grafana release cycle: end-of-year update

It’s been another big year for Grafana. In April, we unveiled Grafana 11.0 at GrafanaCon 2024, which introduced a queryless experience with Explore Metrics and custom visualizations with Canvas panels. Since then, we’ve made improvements to data sources and visualizations in our minor releases, and just last month the 11.3 release marked the general availability of Scenes-powered dashboards.

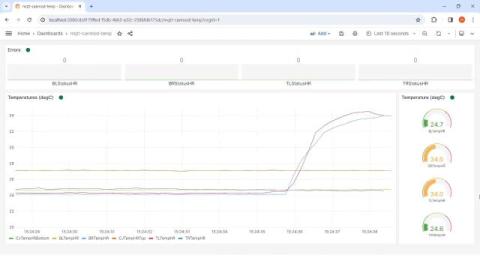
Visualize real-time CAN-to-USB data via custom Grafana dashboards and the MQTT plugin

Martin Falch, co-owner and head of sales and marketing at CSS Electronics, is an expert on CAN bus data. Martin works closely with end users, typically OEM engineers, across diverse industries (automotive, heavy-duty, maritime, industrial). He is passionate about data visualization and has been spearheading the integration of the CANedge/CANmod with Grafana dashboards through various data sources.

What is DNS query resolution policy? How does it help tailor responses for specific segments in your Windows network?

Query Resolution Policy (QRP) is a security feature in ManageEngine DDI Central that allows network administrators to resolve DNS queries for specific clients’ IP addresses in the Windows Microsoft server. This helps secure the confidential network resources of an organization by preventing unauthorized individuals from accessing them. Also, QRP can help categorize certain departments to permit and restrict access to network resources.

IT Monitoring News | November '24 Edition

Welcome to our November edition of the NiCE bi-monthly newsletter! We’re thrilled to share the latest updates, insights, and events to keep you ahead in the ever-evolving IT monitoring landscape, primarily revolving around Microsoft System Center. Whether you’re looking to stay current with new features, understand best practices, or network with fellow professionals, our newsletter has you covered.

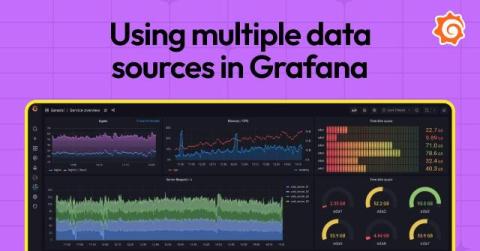
How to work with multiple data sources in Grafana dashboards: best practices to get started

Grafana dashboards enable you to visualize and correlate data from a wide range of sources. With a centralized view of your data, you can troubleshoot faster, make better decisions, and streamline monitoring. But for those of you ramping up with Grafana, you might have a few questions about how, exactly, to create these rich dashboards featuring data from disparate sources, or even how to incorporate multiple queries from a single source into your visualization.

Observability 2.0: Don't repeat sins of the past

If you are moving in the observability circles, chances are that you have heard the phrase “Observability 2.0,” which refers to how we need a new approach to observability. I am incredibly excited about the energy and discussion around a shift to “Observability 2.0,” as we now have a second chance to develop observability the way it was originally envisioned.

Debugging Python Cold Starts with Sentry Profiling and improving our P99 latency by several seconds

At Sentry, we don't just build debugging tools for developers—we use them ourselves. This story demonstrates how we leveraged our own platform to solve a mysterious performance issue that was causing significant latency spikes in our critical infrastructure which is used in nearly every backend request.