Operations | Monitoring | ITSM | DevOps | Cloud

Latest News

Analyze Your Mailchimp Campaigns Using Telegraf

Monitoring your email campaigns helps you track key performance indicators (KPIs) such as open rates, click-through rates, and conversion rates. This evaluation provides insights into the success of your email campaigns and allows you to identify areas for improvement and by analyzing metrics like open rates and click-through rates, you can gauge the level of engagement your emails are generating.

Real Production Readiness with Internal Developer Portals

In cultures of continuous improvement, the criteria by which teams define a release's fitness for production is flexible by definition. Engineering organizations strive to balance risk and velocity, aiming for high quality releases on a cadence that doesn’t impede overall business throughput.

Coming Soon: Cloudsmith Migration Toolkit

One of our core motivations in building Cloudsmith is to make software developers' lives easier. We want Cloudsmith to be one of those great products that feels intuitive and automates everything. As we’re picking up more and larger customers, we’re seeing an increased need for migration tools. We want to make it as easy as possible for teams who are stuck using JFrog Artifactory, or Sonatype Nexus, or other legacy tools to move over to the joy of SaaS artifact management using Cloudsmith.

Finding relationships in your data with embeddings

With the world still working out the limits of LLMs and ever more powerful models being released each month, it’s a little hard to know where to begin. Whether it’s summarising and generating text, building a useful chat assistant, or comparing the relatedness of strings with embeddings, almost all of this now can be done via a few simple API calls. It has never been easier to incorporate these new technologies into your own product.

NGINX Access and Error Logs

Nginx, a widely used web server and reverse proxy, maintains two crucial logs that provide valuable insights into its performance and user interactions: the access log and the error log. These logs play a pivotal role in monitoring and troubleshooting web server activities. The access log records every request made to the server, capturing details such as the requested URL, client's IP address, response status code, and user agent.

How to Monitor Your RabbitMQ Performance Using Telegraf

Monitoring RabbitMQ is essential for maintaining the health, performance, and reliability of your messaging infrastructure. It empowers you to take proactive measures, prevent downtime, and deliver a seamless messaging experience for your applications and users. Monitoring helps you keep an eye on the performance metrics of RabbitMQ, such as message rates, queue lengths, and resource utilization.

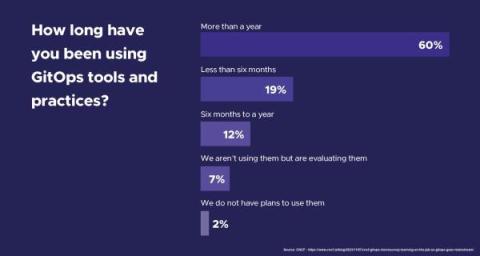
New CNCF Survey Highlights GitOps Adoption Trends - 91% of Respondents Are Already Onboard

Amid all the activity and excitement at KubeCon and ArgoCon 2023 – including some exciting news of our own – the CNCF released the results of a new micro survey assessing trends in GitOps adoption. There’s a lot of great data tucked inside, and worth the read to find out what peers across the industry are saying about GitOps usage in their organizations.

The Benefits of Using DCIM Software for Data Center Cable Management

One of the primary benefits of DCIM software is the enhanced visibility it provides into the physical infrastructure of a data center. This software creates detailed, accurate, and up-to-date maps of all the cabling and connections within the facility. Such documentation is invaluable for troubleshooting, as it enables IT staff to quickly identify and resolve issues related to cable connections.