Operations | Monitoring | ITSM | DevOps | Cloud

Latest News

Observability as a superpower

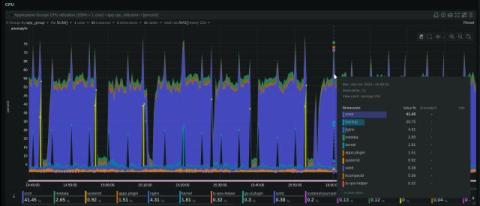
With every job I have, I come across a new observability tool that I can’t live without. It’s also something that’s a superpower for us at incident.io: we often detect bugs faster than our customers can report them to us. A couple of jobs ago, that was Prometheus. In my previous job, it was the fact that we retained all of our logs for 30 days, and had them available to search using the Elastic stack (back then, the ELK stack: Elasticsearch, Logstash, and Kibana).

Top 13 AWS Lambda Alternatives For Serverless Computing

As of 2024, the global serverless computing market is projected to reach a value of USD 21.9 billion, with expectations to grow to USD 44.7 billion by 2029. Around 70% of organizations using AWS have adopted at least one serverless solution. The adoption rates for Google Cloud and Azure are 60% and 49%, respectively. These numbers affirm that serverless is here to stay, and the demand for platforms to create and run applications is higher than ever. AWS Lambda is the most popular serverless platform.

How to Use Data Views to Save Your Monitoring Budget

MetricFire automatically produces different statistical views on the data you send, providing fast views on your metrics at the most appropriate resolution for viewing on your dashboard using Hosted Graphite. This allows you append views to the end of your metric to visualize your data in different ways. Append a view to the end of your metric to visualize your data in different ways.

Linux Load Average Myths and Realities

When it comes to monitoring system performance on Linux, the load average is one of the most referenced metrics. Displayed prominently in tools like top, uptime, and htop, it’s often used as a quick gauge of system load and capacity. But how reliable is it? For complex, multi-threaded applications, load average can paint a misleading picture of actual system performance.

The Parquet Files: An Entertaining Guide to Columnar Storage

Look, I know what you're thinking. Another article about file formats? Really? You'd rather be debugging that mysterious production issue or arguing about tabs versus spaces. But hear me out for a minute. Last week, I was happily hunting through our logs data - you know, the usual terabytes of events that compliance keeps asking for - when our Head of Finance dropped by. "Hey, why is our logging bill so high?" Narrator: And thus began our hero's journey into the world of file formats.

Using Alternatives for the LIMIT Clause in SQL Server

In database management, efficient limiting of query results is crucial for optimizing performance and ensuring the retrieval of relevant data. Many SQL database systems, such as MySQL and PostgreSQL, utilize the LIMIT clause to specify the number of records a query returns. However, SQL Server doesn’t support the LIMIT clause, opting instead for alternatives like TOP, OFFSET-FETCH, and SET ROWCOUNT.

Streamline your IT operations: Harness the power of Ansible Automation Platform with OpManager

ManageEngine OpManager now integrates with Ansible, an open-source automation tool, enhancing its network monitoring capabilities with Ansible’s powerful automation features. This integration enables IT teams to automate routine tasks such as incident response and configuration management, reducing the need for manual intervention and providing a more efficient, streamlined approach to maintaining network reliability and improving overall operational performance.

Infrastructure as Code (IaC): A Guide for DevOps & Developers

Managing IT infrastructure has traditionally been a complex, manual process prone to inefficiencies and human errors. IaC directly addresses these challenges by automating the setup and management of IT infrastructure through code. This approach helps to resolve common infrastructure management problems like lengthy deployment times, configuration drift, and inconsistent configurations.