Operations | Monitoring | ITSM | DevOps | Cloud
Latest News
Send metrics and traces from OpenTelemetry Collector to Datadog via Datadog Exporter
OpenTelemetry is an open source, vendor-neutral observability framework that provides tools, APIs, and SDKs to collect and standardize telemetry data from cloud-native applications and services. One of OpenTelemetry’s key components is the OpenTelemetry Collector, which receives and processes data before using exporters to route it to the destinations of your choice.
Forward logs from the OpenTelemetry Collector with the Datadog Exporter
OpenTelemetry is an open source set of tools and standards that provide visibility into cloud-native applications. OpenTelemetry allows you to collect metrics, traces, and logs from applications written in many languages and export them to a backend of your choice.
If Jimi Hendrix Were Your CIO, You'd Be Rocking Smart Cloud Native
Jimi Hendrix was an innovator who pushed musical boundaries by employing leading-edge technologies as fast as they were invented. The new guitar effects he adopted in the late 1960’s included fuzz, Octavia, wah, and Uni-Vibe pedals. Jimi would gobble up these guitar pedals and incorporate them into his sound to create wildly creative sonic experiences.
Reliability vs. Availability: What's The Difference?
Viewing OpenTelemetry Metrics and Trace Data in Observability by Aria Operations for Applications
Modern application architectures are complex, typically consisting of hundreds of distributed microservices implemented in different languages and by different teams. As a developer, site-reliability engineer, or DevOps professional, you are responsible for the reliability and performance of these complex systems. With observability, you can ask questions about your system and get answers based on the telemetry data it produces.
How to monitor DNS query response time
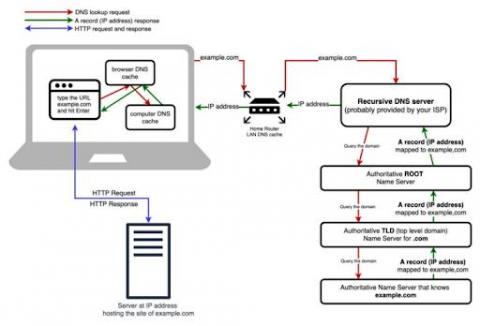
DNS (Domain Name System) servers translate standard language web addresses to their actual IP addresses for network access. DNS response time is the time it takes a Domain Name Server to receive the request for a domain name’s IP address, process it, and return the IP address to the browser or application requesting it. When it comes to DNS response times, the lower the better, and generally values less than 100ms are considered to be in the acceptable range (depending on the application).
How to Fix Poor Google Cloud Latency
Learn how to reduce your latency and get better network performance from the popular cloud service provider.
Canonical works with NVIDIA and BT to unlock infrastructure scalability for data scientists, technical and creative professionals
Ubuntu KVM — an industry-leading hypervisor — extends its reach to AI/ML applications and graphics-intensive applications with native support for NVIDIA virtual GPU (vGPU) software products, including NVIDIA Virtual Compute Server (vCS) and NVIDIA RTX Virtual Workstation (vWS). Canonical has been working closely with NVIDIA to ensure frictionless integration and a best-in-class user experience.
How to change the Tiering of Azure Blobs
In this blog post, I will show you how easy it is to move a single Azure Blob or even select mutlipe or the complete container and move those blobs from any storage tiering to another with just a few clicks. There are cost benefits moving your Azure Blobs down to a lower Storage Tier, Hot being the most expensive, with a cool a little bit cheaper, and the Archive Blob Tier having the lowest cost option. For most Azure Storage Cost saving ideas, we cover some in another blog.


