Operations | Monitoring | ITSM | DevOps | Cloud
Latest News
SaaS Companies Are Reporting Weaker Margins Than They Need To - Here's Why
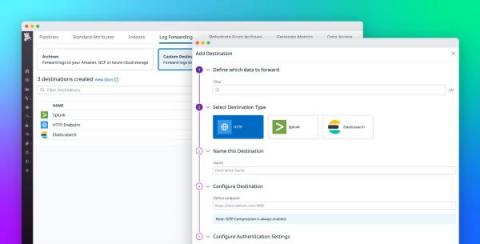
Route logs to third-party systems with Datadog Log Forwarding
Large organizations often rely on multiple monitoring tools, security platforms, and auditing systems to meet the diverse needs of their observability, security, engineering, and compliance teams. Because these teams may use the same logs for many different use cases—including detecting potential threats or breaches, troubleshooting errors, and gauging the effectiveness of new features—it can be difficult to effectively standardize and route data.
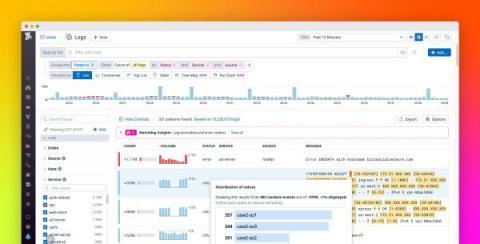
Discover the values behind log patterns with Pattern Inspector
Whether you’re rushing to troubleshoot an incident or proactively performing a security audit, the trial-and-error process of searching through millions of logs for key information can be time-consuming and cumbersome. To help you quickly surface important details from large swaths of log data, Datadog’s Log Explorer allows you to search and filter your logs, create visualizations, as well as group your logs by fields, patterns, or transactions.
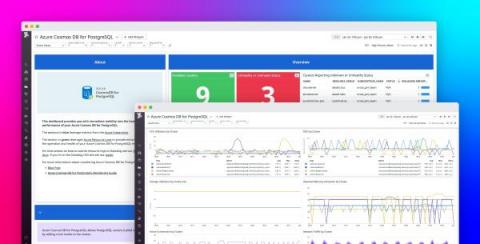
Monitor Azure Cosmos DB for PosgreSQL with Datadog
Azure Cosmos DB for PostgreSQL is a fully managed relational database service for PostgreSQL that is powered by the open source Citus extension. With remote query execution and support for JSON-B, geospatial data, rich indexing, and high-performance scale-out, Cosmos DB for PostgreSQL enables users to build applications on single- or multi-node clusters.
Improve Application Reliability With 4T Monitors
StackState’s new 4T Monitors introduce the ability to monitor IT topology as it changes over time. Now your observability processes can trigger alerts on changes in topology that don’t match an ideal state, on deviations in metrics and events and on complex combinations of parameters. Monitoring topology as part of your observability efforts enriches the concept of environment health by adding the dimension of topology.
How to Find Stranded Capacity in Your Data Center
Data center capacity planning is one of the biggest challenges for today’s data center professionals. According to a recent survey by Sunbird Software, 72% of respondents said that capacity planning was one of their top objectives. Proper capacity planning results in the right-sized data centers, efficient utilization of resources, and reduced costs, but it is easier said than done.
SaC - How to build status pages as code with Terraform
Status pages are a clever solution to bundle all your services, and see the status of them at one sight. We at iLert took this one step further: why not build your status page as code using Terraform? We want to show you how we make it possible, and how you can set it up for your own infrastructure - a real SaC solution.
What Metrics and KPIs Really Matter in Availability?
In our inaugural State of Availability Report, we discovered that not only do metrics matter but the way we use them also does. Our research found that teams with fewer KPIs were more likely to meet their Service Level Agreements (SLAs) and provide their customers with higher levels of availability. The problem with having too many KPIs is that they cause information overload and noise.
Authors' Cut-Gear up! Exploring the Broader Observability Ecosystem of Cloud-Native, DevOps, and SRE
You know that old adage about not seeing the forest for the trees? In our Authors’ Cut series, we’ve been looking at the trees that make up the observability forest—among them, CI/CD pipelines, Service Level Objectives, and the Core Analysis Loop. Today, I'd like to step back and take a look at how observability fits into the broader technical and cultural shifts in technology: cloud-native, DevOps, and SRE.


