Operations | Monitoring | ITSM | DevOps | Cloud
Latest News
What's New? D2iQ Kaptain 1.2!
We are pleased and proud to announce the General Availability of D2iQ Kaptain 1.2. This new update includes new features and improvements to the overall user experience, including: The new dashboard enables users to visually monitor and observe the resource consumption of Kaptain Workloads, observe the state of those workloads, and easily identify and debug any issues.
A Detailed Guide to Real-Time Monitoring
Past performance isn’t always a good predictor of “now” performance, so for this reason, real-time monitoring is a critical part of network management. Organizations must know what’s happening on their network at any given moment. So let’s look at how real-time monitoring can help you accomplish this task.
How NaaS Can Support Development and Testing Environments
Monitoring Load Balancers with Grafana
Load balancers play an important role in distributed computing. With load balancers, you can distribute heavy work loads across multiple resources, which allows you to scale horizontally. Since they are placed prior to computing resources, they need to endure heavy traffic and allocate it to the right resources fast. For this to happen, monitoring the health and performance of load balancers is key. In monitoring, visualization helps users to view various metrics quickly.
Monitoring Network Switches with Grafana
In monitoring, a target system or device is a deciding factor in designing your monitoring stack. You will have to consider various aspects starting from how you want to collect data in what frequency to how you want to surface metrics to end users. You will have to take this strategic approach when you want to monitor your network infrastructure. In this article, we will discuss how Grafana, an open-source visualization tool, can help you to monitor network switches.
How to Build a Multi-Cloud Mindset
We often talk about migrating applications to THE cloud, or running workloads in THE cloud, as if the cloud is one, homogenous environment. The reality is, of course, far more complex. There are private clouds and public clouds—and different public cloud service providers (CSPs) that each have their own particular capabilities and strengths. Modern, digitally transformed businesses usually leverage a combination of these clouds.
How to develop Linux applications for FIPS on Ubuntu
This is the second article in our series regarding FIPS 140 and Ubuntu. The first part of this series, this article, covers running FIPS 140 applications on Ubuntu while this part is focused on the development of FIPS 140 applications on Ubuntu.
Cloud Migration Cost: A Guide
With cloud technology opening up a world of new business opportunities, it has become indispensable for many modern enterprises. From enriching business models and upgrading current infrastructure to delivering the finest customer services, the potentials of cloud technology are immeasurable. To benefit from the cloud, businesses are investing heavily in migrating or modernizing their existing systems to the cloud platform.
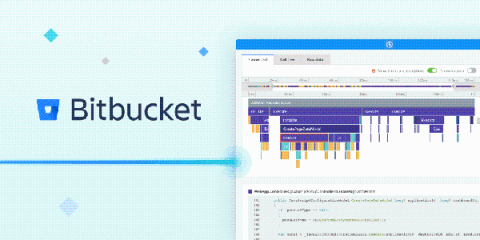
Announcing: Bitbucket for APM
Raygun's latest integration with Bitbucket gives you code-level insights into your traces, directly in APM. Today, Raygun expands its suite of integrations for APM, introducing the latest addition - Bitbucket. Once your Raygun account is integrated with Bitbucket, you'll be able to see method source code pulled directly from your repository when inspecting a method in APM. If this sounds interesting to you but you use GitHub instead of Bitbucket, don't worry, we've got you covered for that too. Gain greater context into code execution and get to the root cause of slow performance, faster.


