Operations | Monitoring | ITSM | DevOps | Cloud

Latest News

Rise of the Digital Operations Ecosystem

Many organizations today are dealing today a lot of complexity and disconnected tools. Teams and departments are running in parallel but siloed from each other. People are burned out from a lot of manual work, and everyone is crunched for time. This is not a happy ecosystem to live in. If this digital ecosystem doesn’t work together, your teams don’t know what’s going on and they lack the right information.

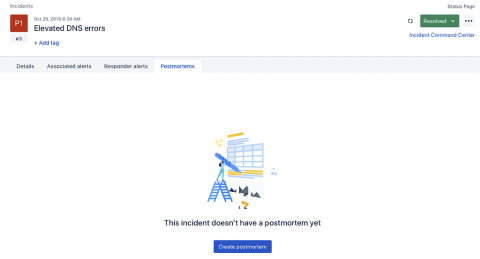
Drive continuous improvement with shareable postmortems in Opsgenie

It’s a given that customers expect software and IT services to be high-performing and always on. And, because incidents and downtime will always be a thing, we believe that how you respond can make or break the customer experience. We’ve learned this lesson first hand while refining our own incident management process over the last decade.

It Came From Below

I’m going to assume most people who read this blog are familiar with PagerDuty. But just in case anyone isn’t, PagerDuty is a tool we use in IT to notify us if some predefined check has failed. Maybe a key process has died or maybe we’re not seeing our expected traffic volume or maybe our server has stopped responding to ping. Whatever it is, PagerDuty will relentlessly, remorselessly, and loudly notify whoever is on call that something needs attention.

Achieve Better Accountability With Full-Service Ownership

Software teams seeking to provide better products and services must focus on faster release cycles. But running reliable systems at ever-increasing speeds presents a big challenge. Software teams can have both quality and speed by adjusting the policies around ongoing service ownership. While on-call plays a large part in this model, advancement in knowledge, more resilient code, increased collaboration, and practice also mean engineers don’t have to wake up to a nightmare.

What is a post mortem incident? How can we monitor this?

In particular, I liked very much the article that our colleague Sara Martin wrote in Pandora FMS blog about crisis management in information technology, these are the steps: Legend: “Jack’s Lantern (https://commons.wikimedia.org/wiki/File:Jack-o-lantern.svg) This article starts from point number five: when after a certain time of recovery the crisis has been solved and becomes a post mortem incident. This word comes from the Latin language and it means “after death”.

How to Manage a Critical Incident

Critical incidents don’t come with a predetermined schedule or warning. So, it’s up to your organization to have an incident response procedure in place to combat these crises. Don’t have one? Read below to perfect your incident response operations and adopt the right tools and procedures to fight against any critical event.

October 2019 Update: Improved usability and new emergency alarm triggering in the app

The October update of the mobile app includes the improvements described below and the user experience includes a new feature. The user interface of the app has been improved so that you can now decide for yourself if you want to see all Signls on the dashboard differentiated by categories. Using the “More” button on the dashboard’s Signl widget, you can now open a context menu and show or hide the display of the categories.

What is MTTD? Mean Time to Detect Explained In Detail

This post will answer a simple question, “What is MTTD?” The answer—or at least the start of it—was already spoiled by the post title. Sure enough, MTTD stands for “Mean time to detect.” It refers to an important KPI (key performance indicator) in DevOps. Is the question answered? Can we call it a day with that definition? Of course not.

Blameless Culture Key to Addressing Outage Outrage in Australia

After the unfortunate Commonwealth Bank of Australia outage last week, the powerful Payment Systems Board—whose members include the chairs of the RBA and APRA – announced it would make all outage data public to prevent banks, payment schemes, and telecommunications carriers from “hiding behind” the performance statistics shared by each institution.

Service Monitoring and You

Monitoring is an art form. That sounds cheesy and lazy, but the right kind of monitoring is very context-dependent and rarely does the same practice work across multiple pieces of software or people. This gets even harder when you think about modern software architectures. Microservices? Container schedulers? Autoscaling groups? Serverless? ${New-technology-that-will-solve-all-of-my-problems-but-probably-creates-other-problems}?