Operations | Monitoring | ITSM | DevOps | Cloud

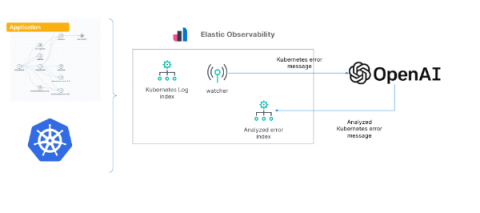
Gain insights into Kubernetes errors with Elastic Observability logs and OpenAI

As we’ve shown in previous blogs, Elastic® provides a way to ingest and manage telemetry from the Kubernetes cluster and the application running on it. Elastic provides out-of-the-box dashboards to help with tracking metrics, log management and analytics, APM functionality (which also supports native OpenTelemetry), and the ability to analyze everything with AIOps features and machine learning (ML).

How your development team can streamline release management with the right collaboration platform

More than 26,000 software vulnerabilities were discovered in 2022 – a new record – and critical vulnerabilities were up 59% over 2021, the previous record-high year. In other words, despite years of DevSecOps, software doesn’t seem to be getting more secure. Release management can help. A crucial goal of release management is vulnerability-free software.

Transport Your Logs to AppSignal with Winston

AppSignal Logging gives you 360-degree insights into your application's performance. To help give you those insights, we wanted to ensure our logging solution allowed you to send AppSignal your logs your way. You can now use Winston transport to send your Node.js application's logs directly to AppSignal and take advantage of having access to all of your application's performance logs and metrics in one place.

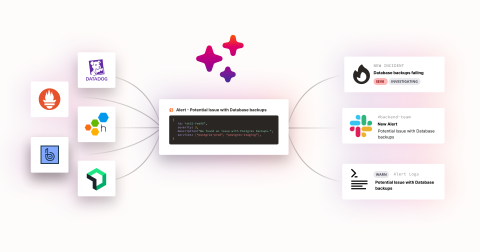
The fastest and most robust path to incident declaration from monitoring tools

Here’s a crazy question: why do we still require a human to manually declare an incident for the things that we know are incidents? If we have enough confidence to build SLOs and high-severity alert routes for these specific scenarios, why are we still asking a human to confirm it’s an incident and get the assembly process in motion? Isn’t that just another button to push when we could be problem solving instead?

A Log's Life Cycle in Coralogix

Coralogix is a full-stack observability platform that effortlessly processes logs, metrics, traces, and security data. More specifically, logs in Coralogix are processed in larger volumes than almost any other observability provider out there, making a log’s life cycle unique. This article will examine the different stages of logs and help you better understand one of the most sophisticated telemetry processing architecture on the market.

Goats on the Road: RSA 2023 Recap

Dr. Anton Chuvakin, a noted warrior/poet/security cybersecurity expert, sums up my thoughts about RSAC 2023 marketing messaging perfectly with this post on Twitter. For those who are new to the vendor hall, the amount of just bad marketing can be overwhelming and confusing. . There’s only one chance to get your message across to your prospects, so make it short and sweet. Anton’s guess of “zero click zero trust” is closer than you think to the truth.

Configuring Azure Logic App Failure Alerts To Stay Ahead

Azure Logic Apps is a cloud-based service provided by Microsoft Azure that allows users to create and run automated workflows. A trigger is the first step of a workflow that specifies the condition for running further steps in that workflow. Azure Logic Apps creates a workflow run each time the trigger fires successfully. The details of each run, including the status, inputs, and outputs of each step of the workflow instance, can be accessed in the run history section of the Logic App.