Operations | Monitoring | ITSM | DevOps | Cloud

Latest News

Office 365 Outage Report & End User Monitoring

Experts Live is one of the largest community conferences with a focus on a broad range of Microsoft technologies including Azure, Office 365, Intune, System Center, Automation, Virtualization (Azure Stack, Docker), and Enterprise Mobility + Security, just to name a few. Top experts from around the world present discussion panels, ask-the-experts sessions and breakout sessions, and cover the latest products, technologies and solutions.

Monitor IBM MQ metrics and logs with Datadog

IBM MQ is enterprise-grade message-oriented middleware (MOM). Previously known as MQSeries and renamed to WebSphere MQ, IBM MQ is known for its stability and reliability. Companies in industries ranging from financial services to retail to aviation use it as an integral part of their backend infrastructure. Datadog’s new IBM MQ integration enables users to collect key metrics and logs from their IBM MQ instances and visualize them with a customizable out-of-the-box dashboard.

Java Garbage Collection Logging with the ELK Stack and Logz.io

Java programs running on JVM create objects on the heap. At some stage, these objects are no longer used and can pile up as “garbage” needlessly taking up memory. Replacing the manual process of explicitly allocating and freeing memory, the Java Garbage Collection process was designed to take care of this problem automatically.

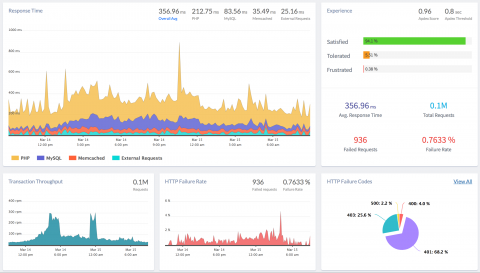
Website Speed Improvements That Increase Ecommerce Conversions

It’s no secret that shoppers want a site that loads fast. Ecommerce websites have to balance looking good and working well to provide the best possible user experience. From product descriptions to user registrations to shopping carts, it can be overwhelming to figure out where to focus your site optimization efforts. Increasing your site’s loading time can double your conversions.

Introducing Guardian DevOps

I started Blue Matador in 2016 to help people like me. Site reliability engineers and devops engineers time is in short supply while the demands keep growing. We support an increasing number of applications, microservices, tools, libraries, languages, runtimes, pipelines, analytics and BI suites, and more. At the same time we’re supporting more applications, the applications themselves are growing more and more complex both from a deployment and a management angle.

timeShift(GrafanaBuzz, 1w) Issue 81

TimeShift is back after a few weeks away with a lot of updates to share. Nearly all of the Videos and presentations from GrafanaCon LA are available, so please check them out and let us know what you think. Also, if you hadn’t heard, Grafana v6.0 stable was recently released which has lots of new features and enhancements. Download the latest version v6.0.1 and read about the highlights below.

A crash course on Serverless with AWS: Centralized logging with Kinesis and Lambda

Don’t you just hate it when APIs are failing and you have absolutely no clue why? Now imagine you don’t have access to the VM, cluster or container where your software is running. Want me to continue with this nightmare? Yes, that’s what debugging AWS Lambda functions tends to seem like. A horrid nightmare of not knowing what is happening nor why things are failing. This article will show you a way of logging function invocations.