Operations | Monitoring | ITSM | DevOps | Cloud

Dashboard Fridays: Sample Google Kubernetes Engine Dashboard

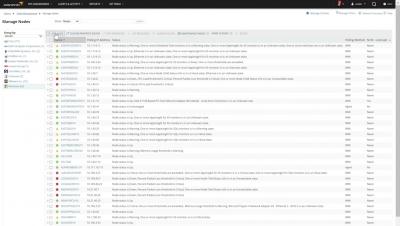
This SquaredUp dashboard shows key metrics from any GKE (Google Kubernetes Engine) clusters and node groups, including utilization of resources and health status. Tune in to learn how it was made, the challenges it solves, and our top tips for building it yourself.

Dashboard Fridays: Sample Grafana Dashboard

This SquaredUp Grafana dashboard surfaces status information from Grafana, giving you a big picture overview across teams and apps – all while allowing you to utilize your existing dashboards and alert rules. Tune in to learn how it was made, the challenges it solves, and our top tips for building it yourself.

Dashboard Fridays: Sample Google Compute Engine Dashboard

This Google Compute Engine dashboard shows key metrics about any GCE instances, managed instance groups, and related resources such as GCE disks. These metrics include utilization of resources and health status. Tune in to learn how it was made, the challenges it solves, and our top tips for building it yourself.

Dashboard Fridays: Sample Azure Application Insights Dashboard

This SquaredUp dashboard uses the Azure plugin to surface key performance metrics from Application Insights. Common user experience metrics are all provided out of the box, and we can query, summarize, and analyse the raw logs and traces. Tune in to learn how it was made, the challenges it solves, and our top tips for building it yourself.

How to set up Heartbeat Alerts within Sematext

Monitoring is an essential part of any IT infrastructure, as it allows you to keep track of the performance and health of your systems. However, simply monitoring your systems is not enough - you need to be alerted when something goes wrong so that you can take action to fix the issue. With Sematext, we automatically set up heartbeat alerts for many of our integrations. However, you can always customize your alerts to suit your needs. You can choose to receive these alerts via email, SMS, or even through a chat tool like Slack.

How to Add SD-WAN Devices to Hybrid Cloud Observability

SD-WAN network monitoring can help you better ensure SD-WAN performance and more easily troubleshoot slowdowns or outages. In this video, you’ll learn how to add new SD-WAN devices for monitoring so that you can get the insights you need for Meraki devices with Hybrid Cloud Observability.

Assessing Observability Maturity at Danske Bank

In order to ensure reliability, IT operations teams today require a deeper understanding of systems than monitoring, along, can provide. In this session, you'll hear insights from Danske Bank about how their observability journey started, the obstacles encountered along the way, what they've achieved in observability so far and, finally, how they measure the maturity of their observability practice.

Resolve Actions ROI Dashboard | Resolve Systems

In this digital age where IT is relied upon to make key decisions and operate faster than the business, nothing is more important than relying on actionable data to drive insights and decision making. The new Resolve Actions ROI Dashboard uplevels data representation for automation, allowing IT to gain key insights that can help drive business decisions. This dashboard comes automatically configured with most commonly measured KPIs that are critical to your business. All you have to do is enter two data points per automation that you want to track and you are off and running.