Operations | Monitoring | ITSM | DevOps | Cloud

Dashboard Fridays: Sample AppDynamics Dashboard

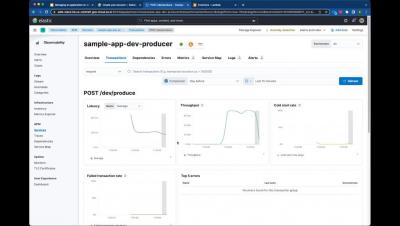
Together, these three AppDynamics dashboards provide a high-level overview of the health and performance of a service – reporting on application-level metrics, infrastructure, and more importantly, end-user experience. Tune in to learn how it was made, the challenges it solves, and our top tips for building it yourself.

S2E5: Dig into the latest features of ServiceDesk Plus Cloud - Masterclass 2022

In this episode, we'll get hands-on with the brand-new features and capabilities of ServiceDesk Plus Cloud released in the last six months. We'll learn how timers in requests and changes, sandbox, announcement banners, and other advancements can refine IT service delivery. Follow us on social.

S2E5: Explore the latest features of ServiceDesk Plus - Masterclass 2022

In this episode, we'll take a peek into the new capabilities and enhancements of ServiceDesk Plus featured in the last six months. We'll learn how request timer actions, bundling custom actions, seeking clarification for approvals, custom triggers and custom functions for problems, and other advancements can refine IT service delivery. Follow us on social.

How OpenTelemetry Powers Observability @ Canva

Canva is an online design platform with a mission to empower everyone in the world to design anything and publish anywhere. To guarantee our customers have the best experience using our products, Canva engineers rely on the tools and products provided by the Observability team to measure and quantify critical application health and performance metrics. Canva’s Observability team uses OpenTelemetry components to collect, transform and export standardised telemetry data from our applications and platforms. Canva has been an early adopter of OTel using OTel SDK for tracing and the collector gateway to process and export telemetry to various tools.