Operations | Monitoring | ITSM | DevOps | Cloud

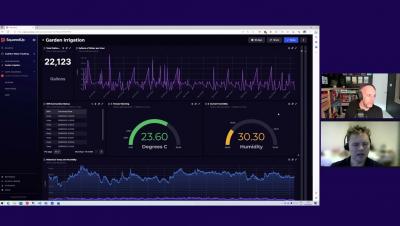
Dashboards & Reports for New-Age Observability with DX UIM from Broadcom

In this 10-minute how-to video, 2nd in a series, learn more about DX UIM for new-age infrastructure observability. Watch to learn about inventory view and grouping, creating metric view dashboards and reports, Performance Reports Designer, List View Designer, and a sneak peek at a unified view.

Do you know where your engineering bottlenecks are hiding?

Do you know where your software engineering bottlenecks are hiding? Jacpocket used Sleuth to track DORA metrics, which revealed the software development team suffered from infrequent releases. Here's how Sleuth helped. Give Sleuth a try and see how we empower software teams to build faster by making engineering efficiency easy to improve and measurable — in a way that both managers and developers love.

Dashboard Stories: Observing Garden Irrigation water usage with SQL

This useful garden irrigation dashboard built in SquaredUp displays a series of data on system availability, water usage and weather conditions. Using the SQL plugin, it pulls data from the Arduino device, allowing me to quickly visualize water usage across any timeframe I choose. This means that I can spot irregularities in usage, which could indicate a leak. I chose to use SquaredUp dashboards for this project, as even though I’m only working with simple data, once you surface it there’s a lot you can do with it!

Holistic Azure Monitoring and Alerting with Single-Pane Visibility

One of the key ways to resolve Azure incident faster is to set up monitoring in business context and achieve a single pane of glass visibility across Azure subscriptions and resource groups. Also, it is significant to alert only on potential issues and relevant team members during an incident to eliminate alert fatigue. In this video, Manish Uppadhaya from Kleinschmidt shares how Serverless360 enhanced their Azure experience by centralizing monitoring and offering tailored alerts.

Top Elasticsearch Metrics to Monitor | Troubleshooting Common error in Elasticsearch

Monitoring Elasticsearch metrics is absolutely essential! Monitoring gives you information about the functionality, overall condition, and performance of your Elasticsearch cluster. Without monitoring, you risk missing important “red-flags” that could make your cluster inaccessible or crash. Which could result in data loss and downtime; both of which would be expensive for your company.

Upgrading NPM and SAM to Hybrid Cloud Observability

This video discusses and demonstrates upgrading an Orion Platform installation running NPM and SAM, to Hybrid Cloud Observability – advanced license. The video discusses system requirements, installation methods and walks through a full demonstration of the upgrade. This video is suitable for anyone who wishes to understand more and see an upgrade from a module based install to Hybrid Cloud Observability.