Operations | Monitoring | ITSM | DevOps | Cloud
Logging
The latest News and Information on Log Management, Log Analytics and related technologies.
Security Observability Trends for 2023
The Best Infrastructure monitoring tools For 2023
In our latest comparison guide for 2023, we'll cover all of the best IT infrastructure monitoring software that you should consider using to maintain uptime and improve your system’s performance.
Splunk Universal Forwarder: Tips & Resources for Universal Forwarders
Curious about Splunk® Universal Forwarders? This article will sum up what they are, why to use them and how the universal forwarder works. Importantly, we’ll point you to the very best tips, tricks and resources on using universal forwarders (and other ways) to get data into Splunk.
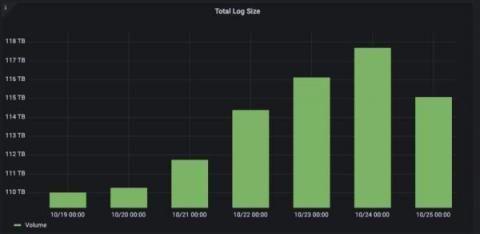
4 billion logs, 120 TB of data: How Just Eat Takeaway.com uses Grafana Cloud to scale
In 2017, Just Eat Takeaway.com (JET) was transitioning from a scrappy startup to a surging scaleup. With a global customer base and workforce, the food delivery marketplace’s front line teams needed to scale the real-time monitoring of the platform. Their initial efforts looked like “NASA’s mission control with Grafana dashboards,” said Senior Technology Manager Alex Murray.
Phantom Metrics: Why Your Monitoring Dashboard May Be Lying to You
Whether you’re a DevOps, SRE, or just a data driven individual, you’re probably addicted to dashboards and metrics. We look at our metrics to see how our system is doing, whether on the infrastructure, the application or the business level. We trust our metrics to show us the status of our system and where it misbehaves. But do our metrics show us what really happened? You’d be surprised how often it’s not the case.
Unreadable Metrics: Why You Can't Find Anything in Your Monitoring Dashboards
Dashboards are powerful tools for monitoring and troubleshooting your system. Too often, however, we run into an incident, jump to the dashboard, just to find ourselves drowning in endless data and unable to find what we need. This could be caused not just by the data overload, but also due to seeing too many or too few colors, inconsistent conventions or the lack of visual cues.
Efficient Help Desk Processes with Centralized Log Management
Another day starting up your laptop or workstation, logging into programs, and waiting for that first call to come in. As an IT help desk analyst, you love when you can solve people’s problems, but sometimes the number of calls feels overwhelming. Although each analyst tier responds to different customer or employee concerns, you all share the same basic job functions like answering calls, asking questions, and research answers.
How to Configure the OTel Community Demo App to Send Telemetry Data to Coralogix
If you’re just getting familiar with full-stack observability and Coralogix and you want to send us your metrics and traces using the new OpenTelemetry Community Demo Application, this blog is here to help you get started. In this simple, step-by-step guide, you will learn how to get telemetry data produced by the OpenTelemetry Demo Webstore into your Coralogix dashboard using Docker on your local machine.


