Operations | Monitoring | ITSM | DevOps | Cloud
The latest News and Information on Log Management, Log Analytics and related technologies.
Introducing Splunk Operator for Kubernetes 2.0
The Splunk Operator for Kubernetes team is extremely pleased to announce the release of version 2.0! This represents the culmination of many months of work by our team and continues to deliver on our commitment to provide a high-quality experience for our customers wishing to deploy Splunk on the Kubernetes platform.
Alerting Techniques for an observable platform
Observable and secure platforms use three connected data sets: logs, metrics, and traces. Platforms can link these data to alerting systems to notify system administrators when an event requires intervention. There are nuances to setting up these alerts so the system is kept healthy and the system administrators are not chasing false positive alerts.
Postcard From .conf22: Customers Inspire Our Latest Release
They say, “What happens in Vegas, stays in Vegas,” but I wanted to highlight the role our customers played at last month’s.conf22, our annual users’ event at the MGM Grand. It was awesome meeting customers in person again, and connecting virtually with thousands more. We had a terrific turnout with 8,200+ customers and partners representing 113 countries and more than 6,500 organizations.
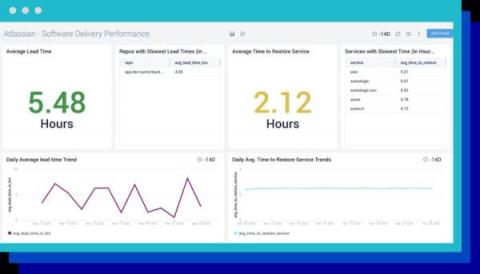
Get better visibility into DevOps performance in one place with Atlassian integrations
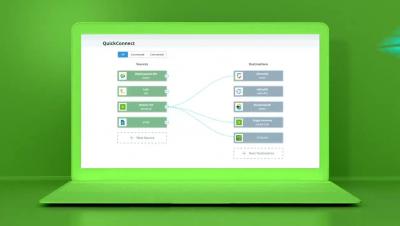
How to Leverage Cribl and Exabeam: Parser Validating
Organizations leverage many different cybersecurity and observability tools for different departments. It’s common to see the IT department using Splunk Enterprise, while the SOC uses Exabeam. Both of these tools use separate agents, each feeding different data to their destinations. Normally this isn’t a problem unless you’re talking about domain controllers. Domain controllers only allow a single agent, meaning you can’t feed two platforms with data.
Cribl.Cloud Simplified with Consumption Pricing
One year ago, we launched Cribl.Cloud as a cloud-hosted option for our industry-leading data pipeline product, Cribl Stream. Customers had a choice of either deploying on-premises with a subscription-based tiered license model or opting for our cloud service with a similar tiered billing model. Fast-forward one year, and Cribl is now a multi-product company with several unique observability products (Stream, Edge, AppScope, and soon Search) to offer our customers.
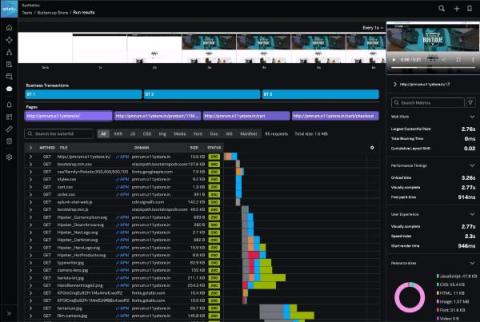
Announcing the General Availability of Synthetic Monitoring Within Splunk Observability
Today we’re proud to announce the general availability of best-in-class Synthetic Monitoring capabilities within Splunk Observability Cloud. Now, IT and engineering teams can proactively measure, monitor and troubleshoot their critical user flows, APIs and services, connected across Splunk Observability.


