Operations | Monitoring | ITSM | DevOps | Cloud
The latest News and Information on Log Management, Log Analytics and related technologies.
Announcing the Winners of the Cribl Packs Contest
It’s time for the Black Hat conference in the United States, so we’re onsite meeting with customers and prospects looking to untangle their data from the grip of vendors holding their data hostage. We aim to start a rebellion against this lock-in and encourage customers to focus on radical choice and control with their observability data. Pushing back against “The Empire” is challenging, but you can achieve it with Cribl Stream and Edge.
To Observability and Back Again: A Context's Journey
How do you pass context from events that concern Security teams to Development teams who can make changes and address those events? Often this involves a series of meetings and discussion that can take days or weeks to filter down from security event to developer awareness. Compounding the problem, developers generally do not have access to Splunk Core, Cloud or Enterprise indexes used by security teams, and indeed, may use only Splunk Observability for their metrics, traces and even logs.
Improving DevOps Performance with DORA Metrics
Everyone in the software industry is in a race to become more agile. We all want to improve the performance of our software development lifecycle (SLDC). But how do you actually do that? If you want to improve your performance, first determine what KPI you’d like to improve. DORA metrics offer a good set of KPIs to track and improve. It started as a research by the DevOps Research and Assessment (DORA) and Google Cloud (which later acquired DORA), to understand what makes high performing teams.
Lessons Learned From Building a Company and Raising Kids
When I had my first child almost six years ago, I expected that most of my time would be spent in the role of a teacher rather than a student. I have two kids now — and I’m certainly teaching them as much as I can as they grow and learn to navigate the world — but if someone were keeping score, my kids might end up on top when it comes to who’s taught who more. Another thing that surprised me is how similar building a family is to build a company from the ground up.
What is Infrastructure as Code?
Cloud services were born at the beginning of 2000 with companies such as Salesforce and Amazon paving the way. Simple Queuing Service (SQS) was the first service to be launched by Amazon Web Services in November 2004. It was offered as a distributed queuing service and it is still one of the most popular services in AWS. By 2006 more and more services were added to the offering list.
The Real Opportunity for Improving Outcomes with Monitoring and Observability
If you were pulled into a meeting right now and asked to give your thoughts on how to achieve better outcomes with monitoring and observability, what would you recommend? Would you default to suggesting that your team improve Mean Time To Detect (MTTD)? Sure, you might make some improvements in that area, but it turns out that most of the opportunities lie in what comes after your system detects an issue. Let’s examine how to measure improvements in monitoring and observability.
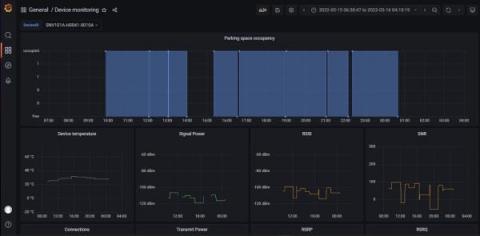
Monitoring smart city IoT devices with Grafana and Grafana Loki: Inside the Fuelics observability stack
For smart cities of the future, monitoring infrastructure metrics like fuel and water levels is vital to optimizing operations. Fuelics PC designs and deploys battery-operated narrowband IoT (NB-IoT) sensors that monitor fuel, water, waste, and even parking capacity at the edge, then transmit that data to the cloud for easy viewing and monitoring.


