Operations | Monitoring | ITSM | DevOps | Cloud
The latest News and Information on Log Management, Log Analytics and related technologies.
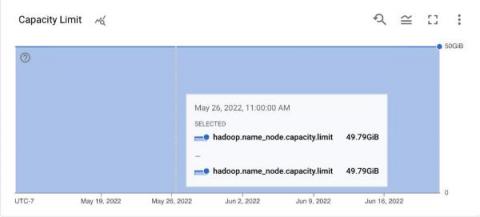
How to monitor Hadoop with OpenTelemetry
Cribl Named as a Big Data Emerging Vendor by CRN
Although we’ve encouraged employees to take plenty of time off this summer to relax, recharge, and enjoy time with family, Cribl certainly hasn’t been on a summer holiday as a company. After the big announcement in late May with Cribl Search and our Series D funding round, we moved right into the announcement of Cribl Stream 3.5, Cribl Edge 3.5, massive upgrades to Cribl.Cloud, and the launch of our Cribl Certified Observability Program.
Content Delivery Networks (CDNs) vs. Load Balancers: What's The Difference?
Load balancers and content delivery networks (CDNs) are critical tools for delivering modern, cloud-native applications. They play essential roles in ensuring the smooth flow of data between applications and end-users. If you don’t have both a load balancer and a CDN in place, you’re probably in a poor position to guarantee the uptime of your application across a wide geographic area. That does not mean, however, that load balancers and CDNs do the same thing.
Learn how application monitoring helps lay the foundation for operational success
How to Collect and Ship Windows Events Logs with OpenTelemetry
Empowering Security Engineers With the Cribl Pack for CrowdStrike
CrowdStrike is a class-leading endpoint monitoring solution. It collects a wealth of activity data from each managed endpoint that can be fairly voluminous. This includes network connectivity, DNS request, process activity, health checks, and the list goes on. In fact, there are over 400 event types reported by CrowdStrike! These events are a gold mine for threat hunters and blue teams looking for unusual or malicious activity. It can be extremely costly to place all this data in a SIEM.
How to Monitor ZooKeeper: Key Metrics & Best Tools [2022 Comparison]
Apache Zookeeper is a great tool used by many popular tools. Your Kafka uses Zookeeper, your HDFS uses it, your SolrCloud uses it, and your ClickHouse may also be using it. No matter where you are using Apache Zookeeper, it is usually a crucial piece of the infrastructure and it needs to be reliable and fast.
Splunk vs ELK
If you have any experience with comparing the leading tools in observability then it is very likely that you will have come across Splunk & ELK during your research. These two titans have provided a swiss army knife of useful tools to many developers, cybersecurity specialists and devops professionals over the years since their inception. In this guide, we’ll be comparing these two leading SIEM tools against each other to help you to decide on which solution will help your security use case.
How Can OpenTelemetry Enhance Application Performance Monitoring?: A Gartner Quick Answer
Earlier this year Gartner published a report discussing OpenTelemetry and its place in enhancing Application Performance Monitoring (APM).


