Operations | Monitoring | ITSM | DevOps | Cloud

Logging

The latest News and Information on Log Management, Log Analytics and related technologies.

Logz.io Enhancements and Changes with Kibana 7

We are happy to inform you that we are upgrading our user interface to support Kibana 7 for Logz.io! Kibana 7 offers users a long list of UI and UX enhancements that will make monitoring and troubleshooting your environment a much simpler and nicer experience. These enhancements include a cross-app dark theme, a new time picker, new filtering, a better dashboarding experience, and most importantly – a significant boost in performance. Shall we take a closer look?

Kibana Lens Overview: An easy, intuitive way to visualize Elasticsearch data

Introducing Kibana Lens, a new simple and intuitive way for everyone to visualize their data inside of Kibana. With a new drag and drop interface, one-click data exploration features, and the power to provide visualization suggestions, Lens is the fastest way to uncover insights in your Elasticsearch data.

Elastic Stack 7.5.0 released

We’re excited to announce the general availability of version 7.5 of the Elastic Stack. Along with the introduction of Kibana Lens, a fast and intuitive way to craft visualizations, this release offers significant enhancements to our Observability and Security solutions and Elastic Enterprise Search joins the 7.5 release train. Read on to see the highlights and dive into the detailed release posts for all the details.

Release 1.19: More efficient DevOps with web log parsing and unit testing

Network monitoring is complex, which is why we’re developing a monitoring tool that will drastically increase DevOps productivity. This release is all about improving Netdata’s day-in, day-out performance. We’re working hard to make deploy enhancements that help engineers make faster, smarter decisions about their systems.

What Is MTTF? Mean Time to Failure Explained in Detail

“What is MTTF?” That’s the question we’ll answer with today’s post. Yep, the article’s title makes it evident that the acronym stands for “mean time to failure.” But that, on its own, doesn’t say anything. What does “mean time to failure” actually mean? Why should you care? That’s what today’s post covers in detail.

Machine learning for cybersecurity: only as effective as your implementation

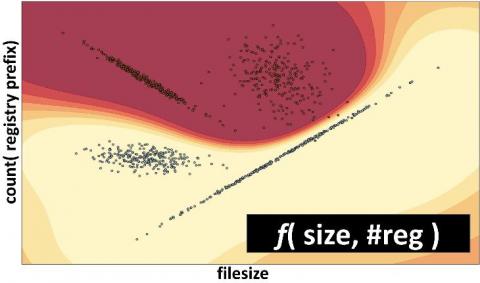
We recently launched Elastic Security, combining the threat hunting and analytics tools from Elastic SIEM with the prevention and response features of Elastic Endpoint Security. This combined solution focuses on detecting and flexibly responding to security threats, with machine learning providing core capabilities for real-time protections, detections, and interactive hunting. But why are machine learning tools so important in information security? How is machine learning being applied?

Dear Search Guard users #2, including Amazon Elasticsearch Service and Open Distro, and others

Back on September 4th, we filed a lawsuit against floragunn GmbH, the makers of Search Guard, a security plugin for Elasticsearch and Kibana, for a multi-year pattern of copying our proprietary code. After filing the claim, we have continued to investigate floragunn’s actions. Today, we have updated our lawsuit in two important ways. First, we have identified additional copying by floragunn with respect to the separate, proprietary code base for our Kibana product.

Preventing and mitigating data loss with Graylog

If you’re handling sensitive information, dealing with data loss can be more than just a headache. Log management tools such as Graylog can enhance your incident response and management strategies, and help you mitigate the damage when a breach occurs in your database. Minimizing data loss with a fast and scalable logging solution is key if you want to bring your cybersecurity to the next level.

Announcing the General Availability of LogDNA Screens

LogDNA is known and loved by developers for our lightning fast live tail and search. With some users ingesting over a petabyte of data per day, our users want to be able to visualize their data and put it to use. You told us what analytics you value most and we’ve taken the first step to providing them within the LogDNA product. The first is having highly interactive graphs. Graphs allow you to analyze patterns and trends by navigating through your data over a period of time.