Operations | Monitoring | ITSM | DevOps | Cloud

Monitoring

The latest News and Information on Monitoring for Websites, Applications, APIs, Infrastructure, and other technologies.

Vodafone Idea BGP Leak - Global Routing System Must Implement MANRS

At the end of last week, a significant BGP leak caused widespread network outages that impacted major network operators, cloud, and CDN providers. The incident on Friday, April 16th, 2021 was (yet another) classic origin hijack case from Vodafone Idea (AS55410), an Indian operator based in Mumbai and Gandhinagar. The Vodafone Idea ASN was inundated with traffic,13 times higher than average, leaving its users unable to access the internet.

Bridge the gap in your OSS by adding an AI brain on top

Telecom companies monitor their network using a variety of monitoring tools. There are separate fault management and performance management platforms for different areas of the network (core, RAN, etc.), and infrastructure is monitored separately. Although these solutions monitor network functions and logic – something that would seem to make sense — in practice this strategy fails to produce accurate and effective monitoring or reduce time to detection of service experience issues.

Dashbird becomes SOC 2 compliant

We are pleased to announce that as of 13th April 2021, Dashbird has successfully completed its SOC 2 Type 2 audit. SOC 2 engagements are based on the AICPA’s Trust Service Criteria. SOC 2 audit reports focus on a Service Organization’s non-financial reporting controls as they relate to the Security of a system. The audit was conducted by Dansa D’Arata Soucia LLP.

Up Close Monitoring with SignalFlow

It’s April, and that means it’s Mathematics and Statistic Awareness month. And in our everyday world of monitoring and observability, both play an ever-increasing role in how we keep track of our environments, both our apps and our infrastructure. Our world is no longer about just pinging the server/app to make sure “It’s alive!”.

Using Telegraf to Collect Infrastructure Performance Metrics

Telegraf is a server-based agent for collecting all kinds of metrics for further processing. It’s a piece of software that you can install anywhere in your infrastructure and it will read metrics from specified sources – typically application logs, events, or data outputs.

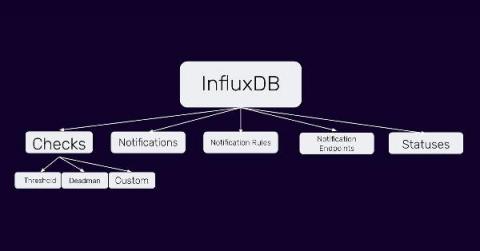
InfluxDB's Checks and Notifications System

InfluxDB 2.0’s Checks and Notifications system is likely the most powerful and flexible system available for creating alerts based on time series data. To get the most out of the system, it is helpful to understand the different pieces and how they fit together. After reading this article, you should be able to create precise alerting using the InfluxDB 2.0 User Interface (UI), as well as be able to extend and customize the system to suit your specific needs.

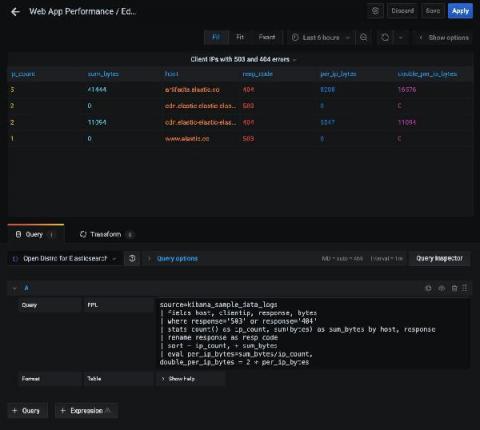
Introducing the new Open Distro for Elasticsearch plugin for Grafana, also available in Amazon Managed Service for Grafana

Back in December, Amazon Web Services (AWS) and Grafana Labs partnered to launch the Amazon Managed Service for Grafana in a preview to a limited set of customers. Amazon Managed Service for Grafana is a scalable managed offering that provides AWS customers a native way to run Grafana directly within AWS alongside all their other AWS services.