Operations | Monitoring | ITSM | DevOps | Cloud

Monitoring

The latest News and Information on Monitoring for Websites, Applications, APIs, Infrastructure, and other technologies.

Tools for HashiCorp Vault monitoring

In Part 1, we looked at the key metrics for monitoring the health and performance of your HashiCorp Vault deployment. We also discussed how Vault server and audit logs can give you additional context for troubleshooting issues ranging from losses in availability to policy misconfiguration. Now, we’ll show you how to access this data with tools that ship with Vault.

Debug Android crashes faster with Datadog

Technical issues, such as fatal crashes, are one of the biggest reasons why users uninstall mobile applications, so quickly identifying and resolving issues is vital for user retention. This can be challenging, particularly in the Android market, which has a wide variety of mobile devices and versions of the Android operating system. You need visibility into every issue so you can determine which crashes impact your application the most and efficiently resolve them.

NiCE Management Pack 3.3 for Microsoft 365 released

The NiCE Active 365 Management Pack for SCOM enables advanced monitoring for Microsoft 365, Teams, SharePoint, OneDrive, Exchange, and AAD Connect in hybrid environments. It ensures end-to-end control for your Microsoft 365 cloud and hybrid services. The new NiCE Active 365 Management Pack 3.3 release comes with great new features.

Using Coralogix + StackPulse to Automatically Enrich Alerts and Manage Incidents

Keeping digital services reliable is more important than ever. When something goes wrong in production, on-call teams face significant pressure to identify and resolve the incident quickly – in order to keep customers happy. But it can be difficult to get the right signals to the right person in a timely fashion.

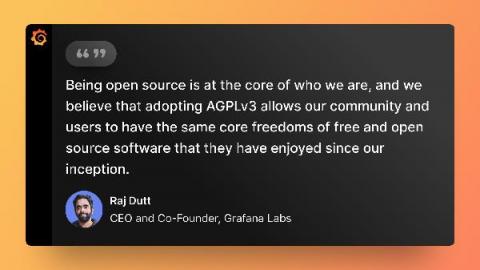
Q&A with Grafana Labs CEO Raj Dutt about our licensing changes

When Grafana Labs CEO and co-founder Raj Dutt announced to the team that the company would be relicensing our core open source projects from Apache 2.0 to AGPLv3, he opened the floor for discussion and encouraged anyone who had further questions to reach out. We believe in honesty and transparency, so we collected hard questions from Grafanistas, and Raj answered them for this public Q&A. The time felt right. As I’ve said publicly before, I’ve been thinking about this topic for years.

Grafana, Loki, and Tempo will be relicensed to AGPLv3

Grafana Labs was founded in 2014 to build a sustainable business around the open source Grafana project, so that revenue from our commercial offerings could be re-invested in the technology and the community. Since then, we’ve expanded further in the open source world — creating Grafana Loki and Grafana Tempo and contributing heavily to projects such as Graphite, Prometheus, and Cortex — while building the Grafana Cloud and Grafana Enterprise Stack products for customers.

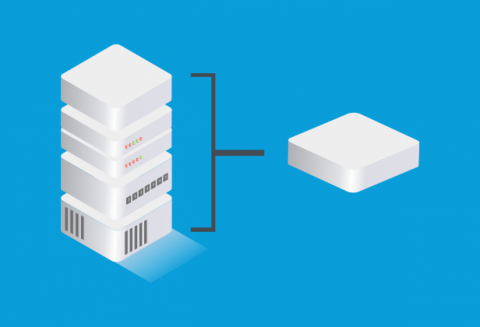
What is Hyperconverged Infrastructure?

Hyperconverged Infrastructure is a unified system that combines computer network and storage in one easy way to manage virtualized systems. To give you a brief understanding, these systems have two major components hypervisors and storage controllers. To elaborate further, typically the hyper converged systems are available as fully integrated hardware appliances and a standalone software. The question now arises how does it work?

Silencing Distractions with Review List and Automations

Responding to and ignoring notifications can be a full-contact sport. It makes sense, though, from GitHub, Slack, to Jira and Sentry; our world revolves around robots telling us everything is important, critical, and urgent. Just like that, it’s near impossible to see what actually matters so you can solve quicker and more comprehensively.

Industry First Citrix Cloud Connector Module

Radnor, PA – April 20, 2021 – Goliath Technologies, a leader in end user experience monitoring and troubleshooting software, announced today they are introducing the industry’s first Citrix Cloud Connector Module. This new module monitors not only the health of the entire Citrix Cloud infrastructure but all Cloud Connectors as well.

Martello iQ | Service Analytics and Monitoring | Live Demo

Martello iQ is a digital experience analytics platform that brings together metrics and events from multiple monitoring, IT services management, business applications tools into actionable dashboards. Accessible from anywhere from any device, iQ presents a unified view of the infrastructure that supports critical business services for your company. See our demo captured in our recent webinar, Guaranteeing Microsoft 365 Service Delivery.