Operations | Monitoring | ITSM | DevOps | Cloud

Monitoring

The latest News and Information on Monitoring for Websites, Applications, APIs, Infrastructure, and other technologies.

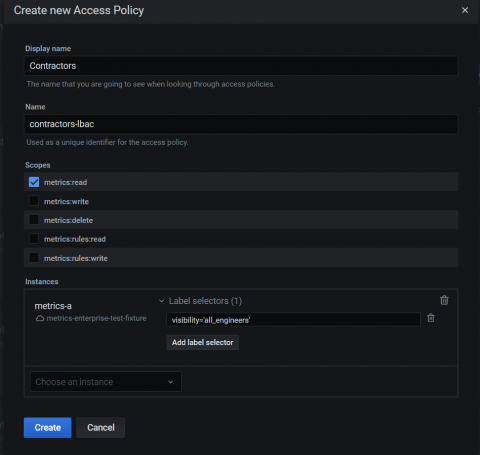
What's new in Grafana Enterprise Metrics for scaling Prometheus: enhanced access control and a compactor that supports 650 million active series and beyond

I’m a fresh starter here at Grafana Labs, leading one of our teams working on the Grafana Enterprise Stack. As a longtime user of Grafana, I couldn’t wait to see what’s new in versions 1.1 and 1.2 of Grafana Enterprise Metrics (GEM), our scalable, self-hosted Prometheus service. I tried out the shiny features and wanted to share some of the cool things I found.

Azure Management Talk: 8 easy steps to improve your security posture in Azure

You've deployed your application on Azure. Instantly hackers are targeting your public IP and the brute forcing of passwords and ports starts. What now? Should I deploy Azure Sentinel, or just enable Azure Security Center as a start? Join MVP and Microsoft RD Maarten Goet as he takes you through the 8 easy steps into improving your security posture on Azure. This is a demo heavy session no cloud engineer or developer should miss!

Guidelines for picking where to send monitoring alerts

If you've ever had to be on the receiving end of a monitoring system that uses email for alerts, you know how noisy things can get. Particularly if you're working in an agency or freelance-like environment, with dozens of client sites to maintain. You get so many emails that you start looking into integrations with third-party services like Zapier, and coming up with more and more complex rules to try reduce the noise.

What if You Could Autonomously Monitor Across Your Databases?

When DevOps teams talk about monitoring a database, the primary motivation is to ensure that the database won’t suffer a performance hiccup. Long queries, timeouts and table scans are among the most popular causes behind lousy customer experience. However, in recent years, more data has been shifted to cloud databases.

Logback Configuration Example: Tutorial on How to Use It for Logging in Java

Troubleshooting issues in your applications can be a complicated task requiring visibility into various components. In the worst-case scenario, to understand what is happening and why it is happening you will need metrics, logs, and traces combined together. Having that information will give you the possibility to slice and dice the data and get to the root cause efficiently. In this article, we will focus on logs and how to configure logging for your Java applications.

Looking Back as We Move Forward: A Pandemic Journey

Until recently, work has been thought of as a place you go, rather than a thing you do. While cloud technology has made a ‘digital workplace’ possible, for many businesses, this has been a long-term ambition. But what happens when this changes overnight? Suddenly more people are at home than in the office, and the typical 9-5 model doesn’t apply anymore. This is the reality that businesses the world over had to face head-on a year ago when the pandemic hit.

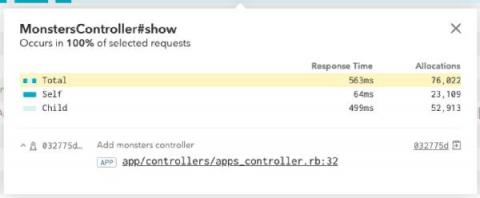
Skylight 5: Now with Source Locations!

This week we released Skylight version 5.0, which represents a major undertaking that has involved every person at Tilde and every part of our ever-growing stack. In addition to major internal refactors, this release also modernizes our native Rust code, and introduces Skylight's newest feature, Source Locations.