Operations | Monitoring | ITSM | DevOps | Cloud

Monitoring

The latest News and Information on Monitoring for Websites, Applications, APIs, Infrastructure, and other technologies.

Top ITSM Trends of 2021

ITSM is a hot topic for people who manage IT infrastructure. And due to the immense changes, we have experienced this past year, there are new developments that show where the industry is headed. ‘Automation’ has been all the craze for the past few years, but it is now more relevant than ever. Then there is ‘digital transformation’, the buzzword of 2021, which is a result of the rapid levels of digitization that all organizations are experiencing.

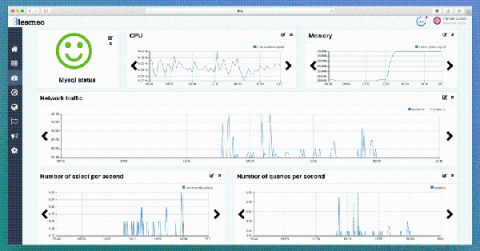
How to monitor your key process with Bleemeo?

This article explains how to monitor service process on your service with Bleemeo using MySQL as an example. This feature is what we called "Key Process Monitoring" and is described by our documentation. Currently, you can monitor any service process automatically discovered by Bleemeo. All metrics are detailed in our documentation, in a few words, metrics related to memory, cpu, network and i/o used by this process are gathered by the agent.

Elastic Security 101

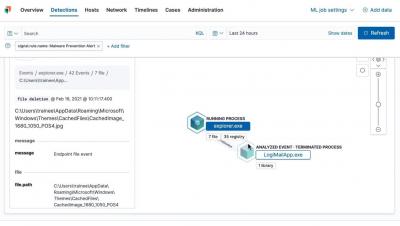
Elastic Security empowers analysts to collect data from multiple data source integrations, perform traditional SIEM functions, and take advantage of machine learning-based malware protection on the endpoint. Analysts can filter, group, and visualize data in real-time while performing automated threat detection across various security events and information. In this video, you’ll learn about the components that make up Elastic Security and what those components do to help you protect your data.

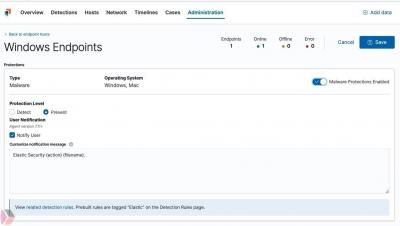
How to configure your Endpoint Integration policy in Elastic Security

Elastic Security offers the ability to open and track security issues using cases. Cases created directly in Elastic Security can be sent to external systems like Atlassian’s Jira, including Jira Service Desk, Jira Core, and Jira Software. In this video, you’ll learn how to connect Elastic Security to the Jira Service Desk.

Pingdom Powered Status Page

Pingdom is one of the most used website monitoring tools, with almost 15 years in the business. It excels at providing simple and reliable synthetics as well as real user monitoring. This monitoring tool provides a simple public status page, but as you might have noticed it’s quite limited. It only serves as a display of your uptime and response time history, not much more than that.

Improve Business KPIs with Splunk APM Business Workflows

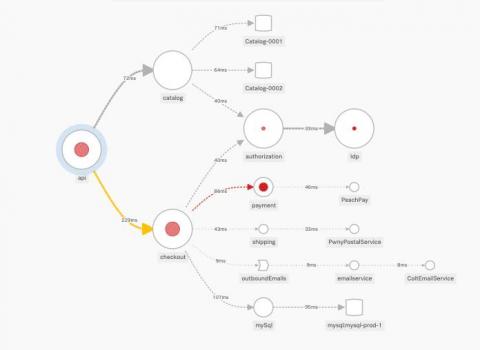
One of the biggest challenges that DevOps teams face is how to connect their efforts with the priorities of business leaders. In conversations we’ve had, developers and SREs discussed how they need to show business and engineering leaders that they are investing their time solving the right problems, and how solving these problems lead to overall better business outcomes.

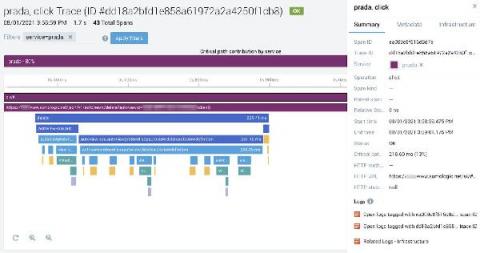
Sumo Logic extends its APM to browser

Over a year ago we decided to invest heavily in Application Observability, understanding the modern observability platform must unite logs, metrics, and traces in one analytics layer to better serve reliability use cases. We have also advocated a modern trend to acquire tracing data via open source industry standards like OpenTelemetry without vendor lock-in.

Enough! 4 Work From Home Solutions to Heal IT's Pain

Let’s face it: when it comes to managing a work-from-home setup, IT has a lot of problems they don’t know how to solve. It’s not for lack of effort – there just don’t seem to be many practical solutions out there that can alleviate their new remote work-induced headaches. It was tough enough getting everyone up and running in home offices. Now, IT is all but drowning in tickets (a majority of tech leaders have reported ticketing increases up to 50%).