Operations | Monitoring | ITSM | DevOps | Cloud
Monitoring
The latest News and Information on Monitoring for Websites, Applications, APIs, Infrastructure, and other technologies.
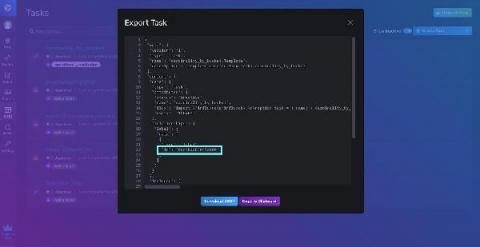
TL;DR InfluxDB Tech Tips: Debugging and Monitoring Tasks with InfluxDB
With InfluxDB you can use Tasks to process data on a schedule. You can also use tasks to write custom alerts. However, sometimes your task will fail. In this TLDR, we’ll learn how to debug your task with the InfluxDB UI and the InfluxDB CLI.
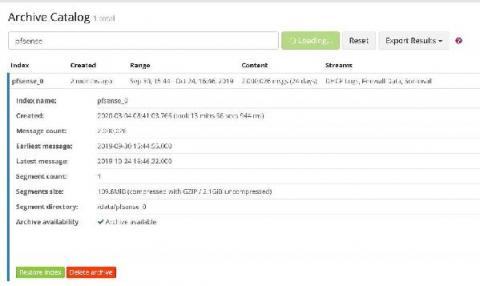
VPN and Firewall Log Management
The hybrid workforce is here to stay. With that in mind, you should start putting more robust cybersecurity controls in place to mitigate risk. Virtual private networks (VPNs) help secure data, but they are also challenging to bring into your log monitoring and management strategy. VPN and firewall log management gives real-time visibility into security risks. Many VPN and firewall log monitoring problems are similar to log management in general.
How to monitor your IoT device in just 2 Simple Steps?
In this post, I will show you, how to monitor your IoT device in just 2 simple steps.
How to Reduce Bandwidth Consumption for Your Network?
Do you know who interacts with whom, when, and for how long and how frequently in your network? Network administrators must have clear visibility of bandwidth utilization using a robust bandwidth monitoring tool, to find out slow loading yet crucial connections, to plan out the capacity of network properly or to control the Quality of Service.
Powerful Caching with Redis for Node.js Applications
Regardless of the tech stack used, many developers have already used Redis or, at least, heard of it. Redis is specifically known for providing distributed caching mechanisms for cluster-based applications. While this is true, it’s not its only purpose. Redis is a powerful and versatile in-memory database. Powerful because it is incredibly super fast. Versatile because it can handle caching, database-like features, session management, real-time analytics, event streaming, etc.
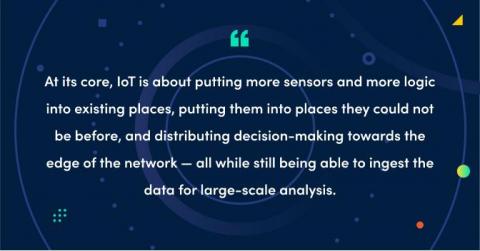
The basics of IoT, and why Prometheus works so well with it
Before we start, please take a moment to appreciate what day it is. IoT, or Internet of Things, has been a buzzword for longer than usual. Buzzwords usually have two common properties, and then their paths fork. I like thinking about buzzwords and about the useful aspects of what they mean. The most recent public example focuses on another buzzword currently in its hype phase: observability.
Four Unique LogicMonitor Dashboards To Inspire You
LogicMonitor dashboards are truly customizable — customizable enough to allow users to visualize virtually anything. Dashboards provide our users with a wide array of capabilities, from capacity planning and service availability notifications to root cause analysis and IT spend forecasting capabilities. We’ve seen LogicMonitor users get radically innovative when it comes to creating unique dashboards that add value to their lives both in and outside of work.
Top 7 Datadog Competitors to Know in 2021
Datadog was founded in 2010 by Olivier Pomel and Alexis Le-Quoc. They develop the Datadog to reduce the friction they experienced between system administration teams and developers. Together they raised over $648 million to bring its valuation to $7.8 billion by the end of 2019. Let’s dig deep into Datadog to know its competitors.


