Operations | Monitoring | ITSM | DevOps | Cloud

Monitoring

The latest News and Information on Monitoring for Websites, Applications, APIs, Infrastructure, and other technologies.

Why Performance Monitoring for Salesforce is Essential

Today we bring you the latest installment in our series of Employee Experience (EX) related eBooks, focused on how Catchpoint can help you guarantee optimal digital experience for your employees. In our last eBook, we looked at how you can best utilize digital experience monitoring for G Suite. In the latest edition, we demonstrate how you can use performance monitoring to ensure the optimal end-user experience for Salesforce.

Insights from the 5th annual Continuous Intelligence Report

For five years, Sumo Logic has created the Continuous Intelligence Report on the state of modern apps and DevSecOps. New to this year’s report are unique insights into how enterprises are adapting to the COVID-19 pandemic— particularly in terms of security threats. Customers use Sumo Logic to manage their production apps and services, and this report provides a reflection of overall trends in technology adoption across entire industries.

How to monitor website performance

Website performance monitoring is an evolving paradigm primarily because website performance is synonymous with business. It goes beyond simple measurement of web services and the features’ ability to respond efficiently to end-users. Plus, the demand of the market―underlying technologies, use cases, issues, and risks― fuels its growth. Certain factors lead to website or web service poor performance. First, there are issues with files; size and quantity.

7 High-Risk Events to Monitor Under GDPR: Lessons Learned from the ICO's BA Penalty Notice

Hello Security Ninjas, Today's IT world is complex and can be challenging for security operations teams. Nowadays, more apps are being integrated and interconnected than ever before. Cloud services and SaaS solutions purchased all throughout the organization outside of the IT department add even more complexity. Communicating to application and service owners the kind of activities that need to be logged and sent to the SOC can be a daunting task.

Gain 5 Layers of Visibility into Your Virtual Infrastructure

Learn how Goliath offers a single console where you can view key performance metrics from your Hypervisor Host (VMware vSphere, Citrix Hypervisor, Microsoft Hyper-V), Virtual Machines, Applications, Operating Systems and Physical Devices. You will learn how to: Identify performance bottlenecks within your virtualized infrastructure. Deploy remediation actions, both manual and automatic, to resolve issues before end users are impacted, and report on key metrics to foster collaboration across IT teams, vendors, management, and end-users.

OpsRamp Discovery and Monitoring 2020

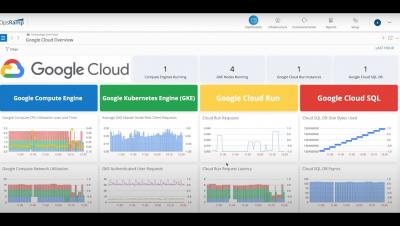
In this video, we will show you how the OpsRamp #Fall2020 release simplifies the discovery and monitoring of #cloud and #cloudnative resources. Learn how OpsRamp’s new onboarding wizard can get you up and running in as little as four steps, and how the new curated dashboards save time so that you can see your infrastructure health in one place quickly, with a modern look and feel.