Operations | Monitoring | ITSM | DevOps | Cloud

Monitoring

The latest News and Information on Monitoring for Websites, Applications, APIs, Infrastructure, and other technologies.

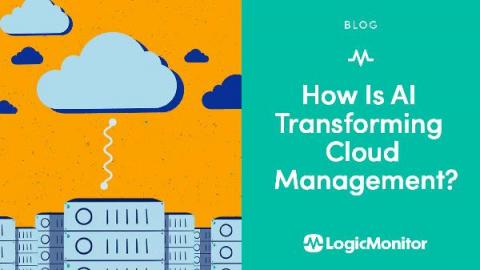
How Is AI Transforming Cloud Management?

In 1927, the world was introduced to the origins of Artificial Intelligence (AI) in the form of a robot in the movie Metropolis. Throughout nearly a century since then, movies have continued to iterate on the complexities of AI, as both a fun take on it and serious commentary on the potential concerns and consequences. This is all well and good, but as AI has continued to evolve, we find ourselves asking, “how can we actually use this to make our lives easier?”

Application Monitoring with the Prometheus Client and GroundWork MonitorGot 7 minutes?

Prometheus is a popular open-source systems monitoring and alerting project. The project is a member of the Cloud Native Computing Foundation, joining in 2016 as the second hosted project, after Kubernetes. In this blog, we will demonstrate how to implement Application Performance Monitoring (APM) using the Prometheus GoLang client libraries API and de-facto standard data transport model to feed monitoring metrics into the GroundWork Monitor 8 server.

Best Monitoring Tools for Hadoop

Apache Hadoop is an open-source software framework that can process and distribute large data sets across multiple clusters of computers. Hadoop was designed to break down data management workloads over a cluster of computers. It divides data processing between multiple nodes, which manages the datasets more efficiently than a single device could. Here is our list of the best Hadoop monitoring tools.

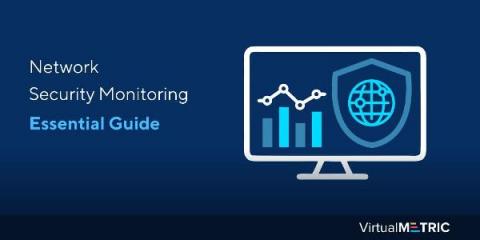
Network Security Monitoring Essential Guide

The conventional monitoring solution focussed primarily on analysing the performance of the network. Gradually, the scope of such tools increased and they are now packed with a host of security features. Focus is now more towards Forensic analysis, security threats analyzer, TCP analyzer, Firewall monitoring, Auditing and Compliances. So, how do you know which network security monitoring tool is essential for you? Which technique will provide the best ROI for your business?

Announcing Native OpenTelemetry Support in Splunk APM

At Splunk, we've been leading the way in observability and helping accelerate the adoption of the OpenTelemetry project. With the trace specification reaching a stable maturity level and several SignalFx Gateway and client library capabilities being upstreamed, we're ready to go all-in while we continue accelerating the growth and adoption of OpenTelemetry beyond the commitments we made last year.

What's New in Splunk Cloud: Part 1

Every business transformation needs a data strategy and the ability to manage increasingly complex environments. And while companies all over the globe are embracing the cloud, this shift has only exacerbated the associated complexity, compounded by the uncertainty brought about by the current global pandemic. You’ve got more data centers and attack surfaces to monitor and secure, in addition to greater unpredictability and risk.

Why Monitor Third-Party Web Applications?

If you provide a web service or benefit from a provided service, there’s typically an agreement between the provider and customers to contractually bind the provider to meet a certain level of service, otherwise known as a Service Level Agreement (SLA). The provider needs to be sure they deliver quality site performance and they’re extremely reliable, at the risk of hurting their brand reputation and losing customers.

What Can Website Uptime History Tell You? (That You Don't Already Know)

According to a 2019 study conducted by Forrester, 44% of the IT directors surveyed indicated their organizations face unplanned downtime bimonthly. The study also estimated unplanned downtime costs 35% more per minute than planned downtime. If you’re an MSP, a failure to meet SLAs for uptime can lead to even higher costs and penalties.

APM Integrated Experience

We’ve been listening to our customers. Whether you’re a SolarWinds® Loggly® or SolarWinds AppOptics™ user, we’ve been working hard to make your life easier. We’re happy to announce a brand-new experience that brings together metrics, traces, and logs in a single platform, making it faster and easier to troubleshoot application and infrastructure issues.

What Can Website Uptime History Tell You? (That You Don't Already Know)

According to a 2019 study conducted by Forrester, 44% of the IT directors surveyed indicated their organizations face unplanned downtime bimonthly. The study also estimated unplanned downtime costs 35% more per minute than planned downtime. If you’re an MSP, a failure to meet SLAs for uptime can lead to even higher costs and penalties.