Operations | Monitoring | ITSM | DevOps | Cloud
Monitoring
The latest News and Information on Monitoring for Websites, Applications, APIs, Infrastructure, and other technologies.
Honeycomb Learn Ep 5 Never Alone On Call
FTP and SFTP: What's The Difference?
In the Information Age, data is currency. Controlling the flow of information and more importantly, protecting it has increasingly become a focal point for companies who want to remain competitive in modern markets. Improving data efficiency, integrity, and security is often how companies separate themselves from their peers. We present two of the most common methods for data transfers: FTP and SFTP.
Communicate with Service Status Messaging
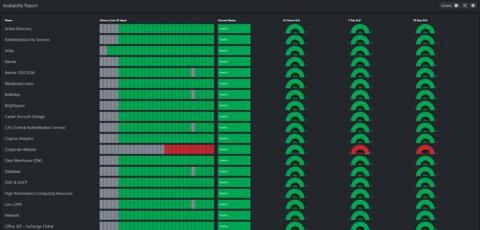
Sometimes an organization gets bogged down with the details. It happens. You have all of this fantastic data in SCOM, and you’re trying to share it, but your users don’t care. That’s not true. They care, but what they don’t care about is the server. To put it another way, they care if the service or application they depend on is working. But here’s the catch, you can’t do this in SCOM.
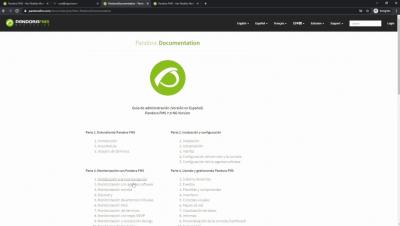
VMWare Monitoring with Pandora FMS: Discovery
The Central Role of Application Performance Monitoring in Enterprise IT
After all, when an IT outage occurs, it disrupts the business. Employee productivity is impacted, customers are unable to transact, and the organization’s brand is at stake. Monitoring needs to cover all aspects of IT – from hardware, to storage, to server to the application stack. With the focus on keeping users happy, the importance of monitoring at the application layer has had more attention recently.
Uptime monitoring: A boon for your business
A highly functional IT network is the basis of any successful modern business, and for effective operations, organizations must monitor the health and availability of all their IT infrastructure components and ensure they’re up and running 24×7. Uptime is the duration during which a network component is reachable and capable of operating efficiently. Typical networks use ICMP or TCP to communicate with devices and identify idle or inactive ones.
Exoprise Nominated for MassTLC's Tech Top 50 program
How to Monitor AWS Kinesis with CloudWatch
If you’re using AWS Kinesis in your application, you’ll want to monitor your Kinesis streams to make sure they are healthy and that your producers and consumers are interacting with them correctly. CloudWatch exposes many metrics that can help you determine the health of your Kinesis streams, but it can be a pain to set up. In this post, we’ll discuss the metrics that are most helpful, how to get CloudWatch up and monitoring your Kinesis streams, plus an easier alternative.
What is Prometheus?
In recent times, Prometheus has become the standard for application monitoring in the tech space. But what exactly is Prometheus? Over the course of this article, we’ll touch on various subtopics to help answer this question, ranging from where it all started, to its architecture and how exactly it does monitoring. We'll address the various possible integrations/tools that can be used alongside Prometheus, and why Prometheus is a great tool for monitoring these platforms and applications.


