Operations | Monitoring | ITSM | DevOps | Cloud

Monitoring

The latest News and Information on Monitoring for Websites, Applications, APIs, Infrastructure, and other technologies.

GrafanaCONline week three: Plugins, Chrome browsing data, Prometheus rate queries, and more

The third and last week of GrafanaCONline starts today! We hope you’re able to check out all of our great online sessions. If you’ve missed any sessions (or want to watch them again), the videos are available on demand here. Here’s what’s coming up today...

Monitoring AWS Application-Related Services

Amazon Web Services (AWS) has a suite of tools that help application development teams enhance and streamline their work experience, from the backend to frontend services. LogicMonitor consolidates data from these services and empowers users to monitor them side by side with the rest of their infrastructure, whether it’s in the Cloud or on-premises. Keep reading for tips on monitoring some of these services to ensure business continuity.

Migrating Management Packs When Upgrading SCOM

Management Packs contain the actual monitoring (the workflows themselves) as well as extend the SCOM platforms functionality and are critical to getting your new SCOM Management Group up and running. The good news is most of SCOM Management Packs that worked with SCOM 2012 R2 work right through to SCOM 2019, so you are safe to import them into your new Management Group.

Alert Tuning for Your Upgraded SCOM Environment

If you know which MPs your overrides are stored in, then migrating your current effective tuning is as easy as exporting all of your override MPs, and then importing them into your new SCOM Management Group, assuming you have already imported the MPs containing the monitoring itself. As you also know, in most SCOM deployments, this is never reality across the board.

Elastic Observability Engineer Training Preview: Structuring data

Hello! This session will be delivered virtually by Tamara Rosini and Lutf Ur Rehman, Education Engineers at Elastic. They will guide us through the new Elastic Observability Engineer course while providing tips on how to structure data properly as an observability best practice. Properly parsing and structuring your data is an important first step in building an efficient and effective observability solution using the Elastic Stack. Effectively indexing and structuring data into Elasticsearch is critical for establishing efficient search criteria and effective results.

GrafanaCONline: Grafana plugins

With Grafana 7.0 we are graduating our packages for Plugin Developers to a beta stage. These packages (@grafana/ui, @grafana/data, @grafana/runtime and last but not least @grafana/toolkit) are aimed to simplify the developer experience for those who wish to extend the Grafana platform. In this webinar I’ll present key ideas behind these packages and the way how you can use them to build for the Grafana Platform and create consistent experiences for the audience of your plugins.

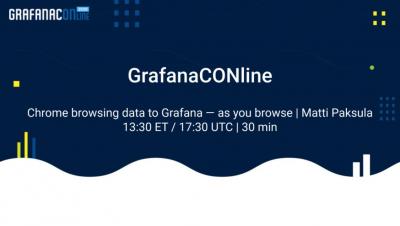
GrafanaCONline: Chrome browsing data to Grafana - as you browse

Chrome Devtools is used by all web developers to debug and inspect network traffic. Sometimes the page loads sluggishly, and then you open Devtools and reload the page, and the problem is gone. What if you wanted to know how well the site performs, for example, when you click six pages? While it is possible to keep the tab open at all times, it is hard to see the big picture from the data in the network tab. This is a wonderful use case for time series and Grafana! In this presentation I will show how to get the same data visualized in Grafana in near real time (1s delay) without opening the Devtools at all.