Operations | Monitoring | ITSM | DevOps | Cloud
Monitoring
The latest News and Information on Monitoring for Websites, Applications, APIs, Infrastructure, and other technologies.
NiCE PowerHA Management Pack 1 40 Release
Loki's Path to GA: Adding Structure to Unstructured Logs
Launched at KubeCon North America last December, Loki is a Prometheus-inspired service that optimizes storage, search, and aggregation while making logs easy to explore natively in Grafana. Loki is designed to work easily both as microservices and as monoliths, and correlates logs and metrics to save users money. Less than a year later, Loki has almost 6,500 stars on GitHub and is now quickly approaching GA.
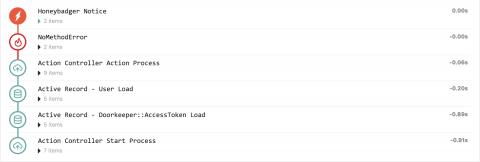
Introducing Breadcrumbs
Have you ever dealt with an error in production, and no matter what you try, you can't replicate the issue on your development or staging environments? Often the next step is to gather more data by tossing a debug log at production. If you don't have a good way to correlate logs with a request it can be frustrating, especially during an incident. We added a feature to help, and it's called Breadcrumbs.
Field Guide: Mitigating Risk While Transitioning Databases
Welcome to our series of blog posts about things Sentry does that perhaps we shouldn’t do. Don’t get us wrong — we don’t regret our decisions. We’re sharing our notes in case you also choose the path less traveled. In this post, we’re giving context to everything that needed to happen before we introduced Snuba, our new storage and query service for event data.
Level Up Visibility and Flexibility to Increase (Business) Velocity
With LogicMonitor, users gain visibility into the health of business systems quickly, ensuring food stays at safe temperatures, spinning wheels don’t interrupt your favorite streaming shows, and travel reservations go through in seconds. Here are some innovations we demonstrated and announced that increase visibility:
Icinga 2.11 Release Candidate
For months we have been working on one of the biggest and most important releases since the creation of Icinga 2. Icinga 2 version 2.11 includes improvements for performance, stability and scalability. After many changes of lines of code, additions and deletions we believe we’re finally there. But we want to have you on board, so we decided to go with a Release Candidate first. Today we’re happy to announce the general availability of this release!
Using Elasticsearch Rollover to manage indices
In this article you will learn how to configure and use the Elasticsearch rollover feature in Jaeger. Note that this feature has been introduced in Jaeger 1.10.0. Jaeger uses index-per-day pattern to store its data to Elasticsearch. It creates a new index for each day based on span’s timestamp. These indices have to be periodically removed by jaeger-es-index-cleaner cron job. Typically users keep data from one week up to one month which results in 7 or 30 indices only for spans.
OpsRamp Launches New Partner Program to Help Technology and Solution Partners Deliver Greater Customer Value
Having worked with managed service providers, technology integrators, value-added resellers, and cloud service providers across the world, OpsRamp understands what it takes to create great partnerships. Over the last five years, we have learned a lot about fostering smart and committed relationships with our partner ecosystem. Relationships are key in a world of rapid change and constant innovation. Healthy partner relationships require constant nurturing, collaboration, and enablement.
Building better software with automated monitoring and alerting
This is a guest article by Dan Holloran from VictorOps – an on-call alerting and incident response tool recently acquired by Splunk. They are experts in incident management. In software development and IT operations, we tend to focus a lot of our time on the delivery and deployment pipeline. But, what happens after you deploy new services? How are you responding to incidents in production and identifying reliability concerns?


