Operations | Monitoring | ITSM | DevOps | Cloud

Monitoring

The latest News and Information on Monitoring for Websites, Applications, APIs, Infrastructure, and other technologies.

Introducing granular permissions: Customize team member's access for finer control

Thousands of developers work in Raygun every day. But as the number of team members added to your organization grows, it can be tough to make sure only plan Owners have access to major plan settings in Raygun. Starting today, if you are a plan Owner, granular permissions will help you gain more control over who has access to key Raygun settings at the product, app and plan level.

Top Node.js Metrics to Monitor

Making Node.js applications quick and sturdy is a tricky task to get right. Nailing the performance just right with the V8 engine Node.js is built on is not at all as simple as one would think. JavaScript is a dynamically typed language, where you let the interpreter assign types to variables. If you’re not careful this can lead to memory leaks.

Node.js Monitoring Made Easy with Sematext

Node.js monitoring is a tricky task. There are certain challenges to look out for. Because Node.js is a dynamically typed programming language and single-threaded you give the interpreter and runtime a lot of freedom to make decisions. This can easily result in memory leaks and high CPU loads. Parallel execution is simulated in Node.js by using asynchronous execution of functions. But, if a single function blocks the thread or event queue, the application performance will take a huge hit.

Automating Scheduled Down Time with the ServiceNow CMDB Integration

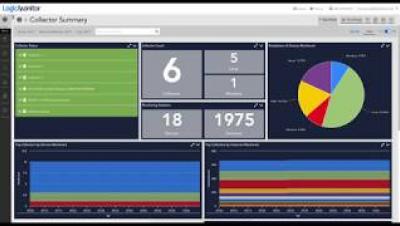
Managing CIs has become ubiquitous in the CMDB Sync landscape, but taking that connection between further and providing deeper functionality was planned from the start. This video demonstrates as recently released Update Set that combines the Change Management feature of ServiceNow with LogicMonitor’s ability to set Scheduled Down Time on Devices and Instances.

LogicMonitor CMDB Integration: Have it Your Way

We all want better results with less effort. Automation increases reliability and improves quality. These truths mean that every software company out there is trying to accomplish a similar end result for their customers. But let's face it - no single company is going to get there alone, it's too big a job for just one tool. Your best option is to use the best tools for their specific feature sets... but make sure they play well together, in order to get the results you want.

10

Last week I told Blerim that Icinga came to life on 6.5.2009 … really, 10 years already? A small group of Nagios community members stood up and wanted to create more than a monitoring core with an enhanced web interface. APIs, integrations, backends, scaling, metrics, … A lot of passion and love was received from the community and actually, the Nagios ecosystem became more active again.

Announcing PagerDuty's Solution For HybridOps

For years, traditional infrastructure provisioning and management followed a specific operating model that depended on Network Operations Centers (NOCs) to process operational events. As enterprise companies started to undergo digital transformation, the cloud created a different operating model: One that was much more agile and, some would argue, more efficient—and would replace all other operating models to create IT homogeneity.