Operations | Monitoring | ITSM | DevOps | Cloud
Monitoring
The latest News and Information on Monitoring for Websites, Applications, APIs, Infrastructure, and other technologies.
Closing Panel - Adam Savitzky, Alex Landau, Jason Yee
APM & Distributed Tracing - Priyanshi Gupta
Close the Visibility Gap for Modern Cloud Native Services with OpsRamp's Kubernetes Monitoring
With the adoption of agile microservices, enterprise IT teams have rapidly transitioned from managing pets (physical and virtual servers) to cattle (public cloud services) to now chickens (containerized infrastructure). Container platforms like Docker and container orchestration engines like Kubernetes are helping IT operators drive greater agility, portability, and flexibility for scaling, managing, and optimizing microservices architectures.
How to monitor Oracle Traffic Director(OTD) Components and Instances?
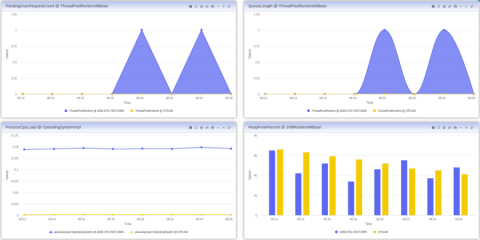
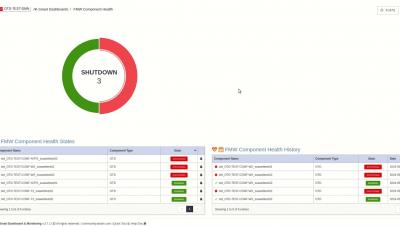
Previously on WLSDM blog, we announced our products new release with “New Release WLSDM 3.7.1 and WL-OPC 1.2.0 is common available!” post. WLSDM and WL-OPC release offers a complete Oracle FMW product stack monitoring infrastructure for your FMW domains and their system components and instances. In this blog post, we have created another tutorial to learn how to monitor and diagnose Oracle Traffic Director (OTD) Components and Instances.
WLSDM: How to monitor Oracle Traffic Director?
3 MSP Sales Mistakes
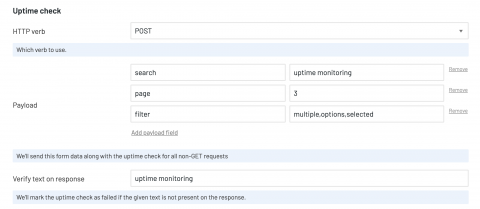
Extending uptime monitoring with POST, PUT & PATCH methods
Next to our standard uptime monitoring through GET requests, we've added support for POST, PUT & PATCH methods too.
Ask Us Anything: Should I Run Prometheus in a Container?
At Grafana Labs, we field questions about best practices from customers all the time. One company recently asked whether it should run a containerized Prometheus environment rather than a VM-based one. We thought we’d share our answer here too. So: Should you run Prometheus in a container?
AlarmsOne and Applications Manager now have a tight webhook integration
To make your application monitoring easier, we’ve built a tighter integration between AlarmsOne and Applications Manager. AlarmsOne already has a Poller-based integration with Applications Manager; however, now it has a webhook integration that will have you receiving alerts in a jiffy.


