Operations | Monitoring | ITSM | DevOps | Cloud
Monitoring
The latest News and Information on Monitoring for Websites, Applications, APIs, Infrastructure, and other technologies.
Solr Key Metrics to Monitor
As the first part of the three-part series on monitoring Apache Solr, this article explores which Solr metrics are important to monitor and why. The second part of the series covers Solr open source monitoring tools and identify the tools and techniques you need to help you monitor and administer Solr and SolrCloud in production.
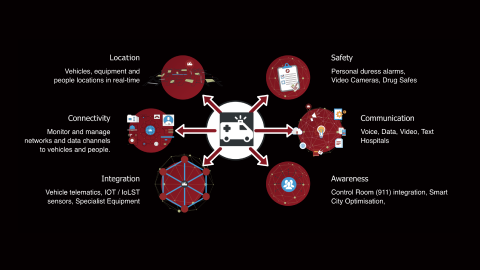
Using Grafana to Monitor EMS Ambulance Service Operations
The Emergency Services team at Trapeze Group provides 24/7/365 support for ambulances in Australia. Each fleet can contain as many as 1,000 vehicles, with more than 60 telemetry channels and 120 million messages going in and out to paramedics every day.
Solr Monitoring Made Easy with Sematext
As shown in Part 1 Solr Key Metrics to Monitor, the setup, tuning, and operations of Solr require deep insights into the performance metrics such as request rate and latency, JVM memory utilization, garbage collector work time and count and many more. Sematext provides an excellent alternative to other Solr monitoring tools.
Solr Open Source Monitoring Tools
Open source software adoption continues to grow. Tools like Kafka and Solr are widely used in small startups, ones that are using cloud ready tools from the start, but also in large enterprises, where legacy software is getting faster by incorporating new tools. In this second part of our Solr monitoring series (see the first part discussing Solr metrics to monitor), we will explore some of the open source tools available to monitor Solr nodes and clusters.
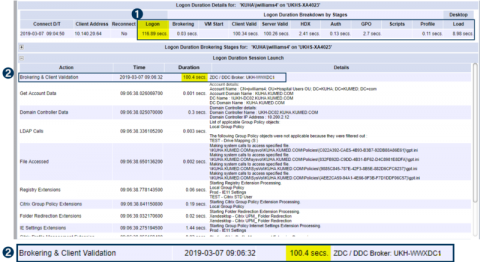
User Story: Epic Hospital Reduces Logon Times by 80%
The below screen shots were provided by a large non-profit healthcare organization that includes 4 acute care hospitals, over 20 clinics and 5,000 Citrix users. The Healthcare IT team received reports from clinicians about slow logon times. This document describes how the Citrix engineer used Goliath Performance Monitor to pinpoint and troubleshoot the “Citrix is Slow” complaint and implement a fix action that permanently resolved the issue while reducing logon times by more than 80%.
Distributed Machine Learning With PySpark
Spark is known as a fast general-purpose cluster-computing framework for processing big data. In this post, we’re going to cover how Spark works under the hood and the things you need to know to be able to effectively perform distributing machine learning using PySpark. The post assumes basic familiarity with Python and the concepts of machine learning like regression, gradient descent, etc.
Dynamic Thresholds, the New [old] Buzzword
At LogicMonitor, we talk to customers and prospects constantly. This enables us to observe trends in requests for new features and functionality. There are two major topics that prospects and customers have been raising recently.


